- Home >
- Stock Photos >
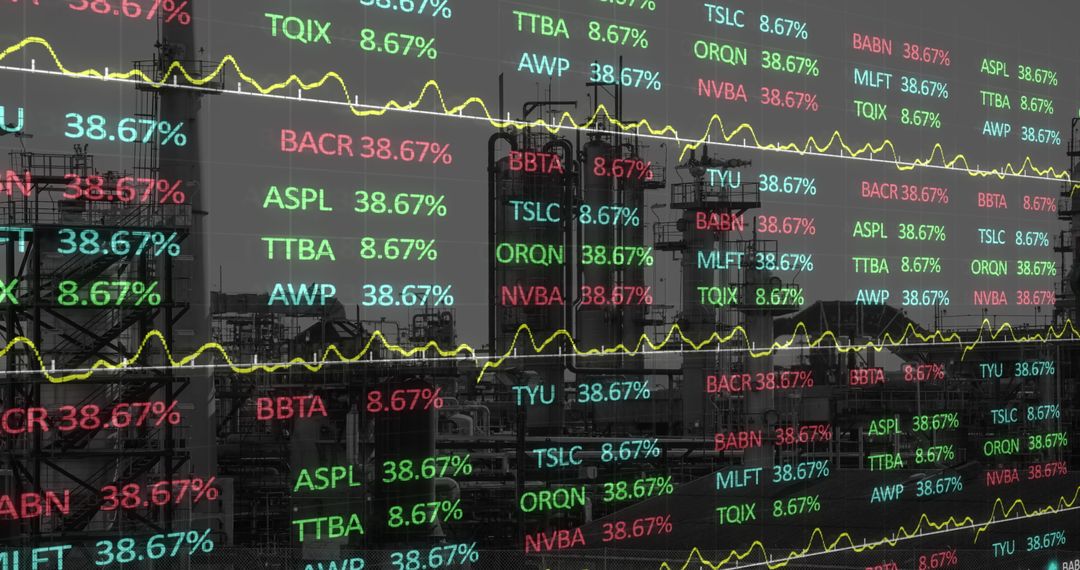
- Dynamic Stock Market Trends with Fluctuating Chart Lines
Dynamic Stock Market Trends with Fluctuating Chart Lines Image

Visualization of fluctuating stock market levels with numbers and colored arrows indicating shifts. Suitable for contexts such as financial reports, economic articles, investment analysis, and presentations on market dynamics or trading forecasts.
Powered by  - Get 15% off with code: PIKWIZARD15


2
downloads
downloads
Tags:
More
Credit Photo
If you would like to credit the Photo, here are some ways you can do so
Text Link
photo Link
<span class="text-link">
<span>
<a target="_blank" href=https://pikwizard.com/photo/dynamic-stock-market-trends-with-fluctuating-chart-lines/7221621c80262e7a50c0ac21c5ef7144/>PikWizard</a>
</span>
</span>
<span class="image-link">
<span
style="margin: 0 0 20px 0; display: inline-block; vertical-align: middle; width: 100%;"
>
<a
target="_blank"
href="https://pikwizard.com/photo/dynamic-stock-market-trends-with-fluctuating-chart-lines/7221621c80262e7a50c0ac21c5ef7144/"
style="text-decoration: none; font-size: 10px; margin: 0;"
>
<img src="https://pikwizard.com/pw/medium/7221621c80262e7a50c0ac21c5ef7144.jpg" style="margin: 0; width: 100%;" alt="" />
<p style="font-size: 12px; margin: 0;">PikWizard</p>
</a>
</span>
</span>
Free (free of charge)
Free for personal and commercial use.
Author: People Creations
Similar Free Stock Images

Premium


Premium


Premium


Premium


Premium


Premium


Premium


Premium


Premium


Premium


Premium


Premium


Premium


Premium


Premium


Premium


Premium


Premium


Premium


Premium


Premium


Premium


Premium


Premium