- Home >
- Stock Photos >
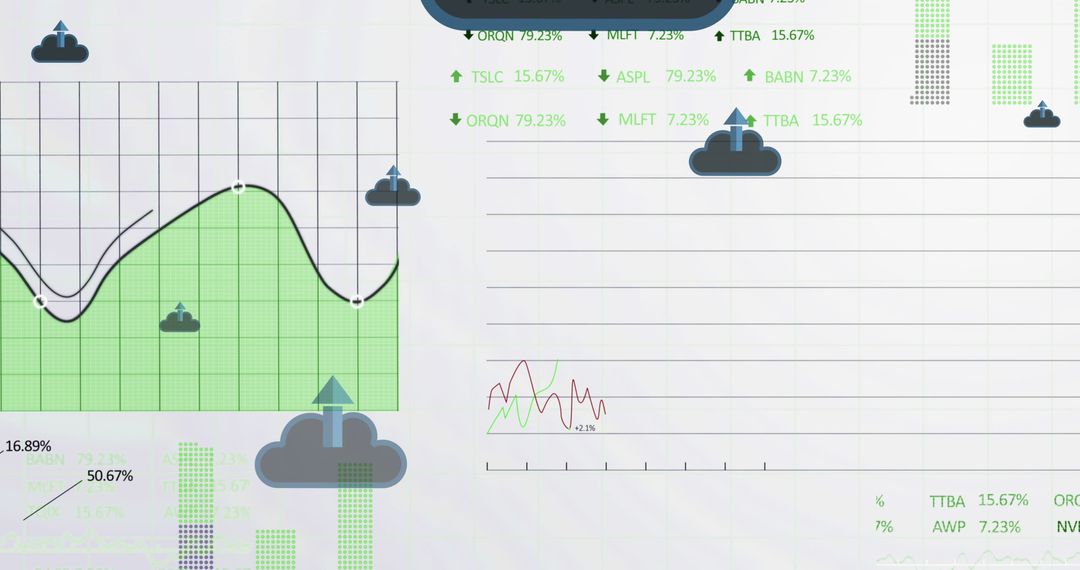
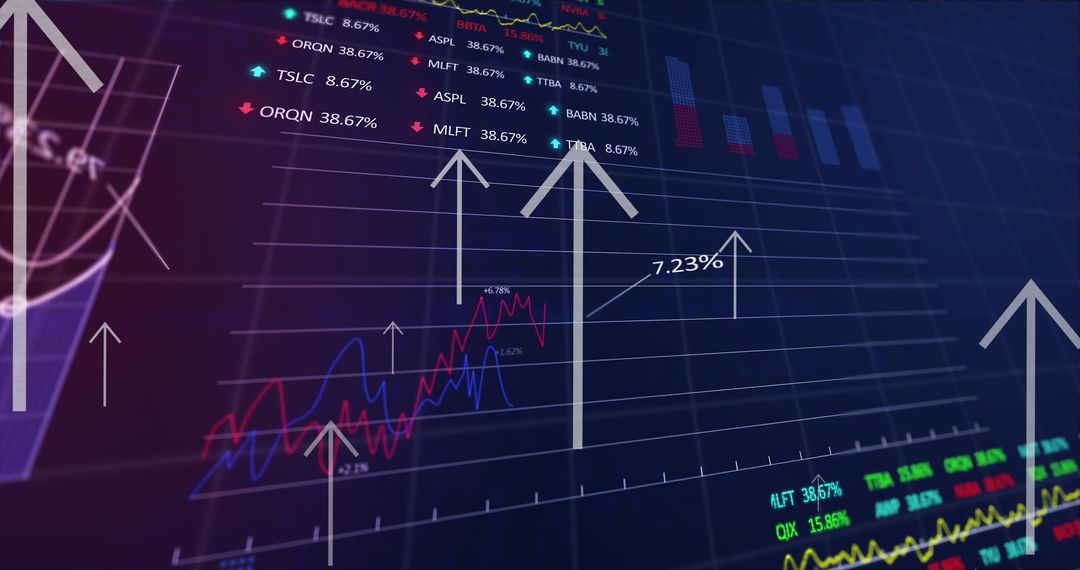
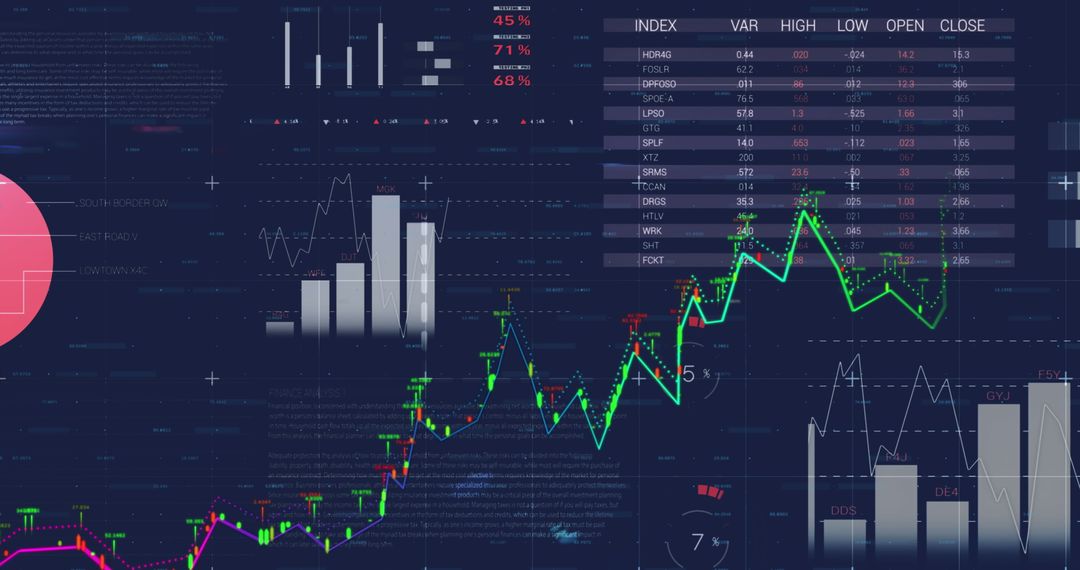
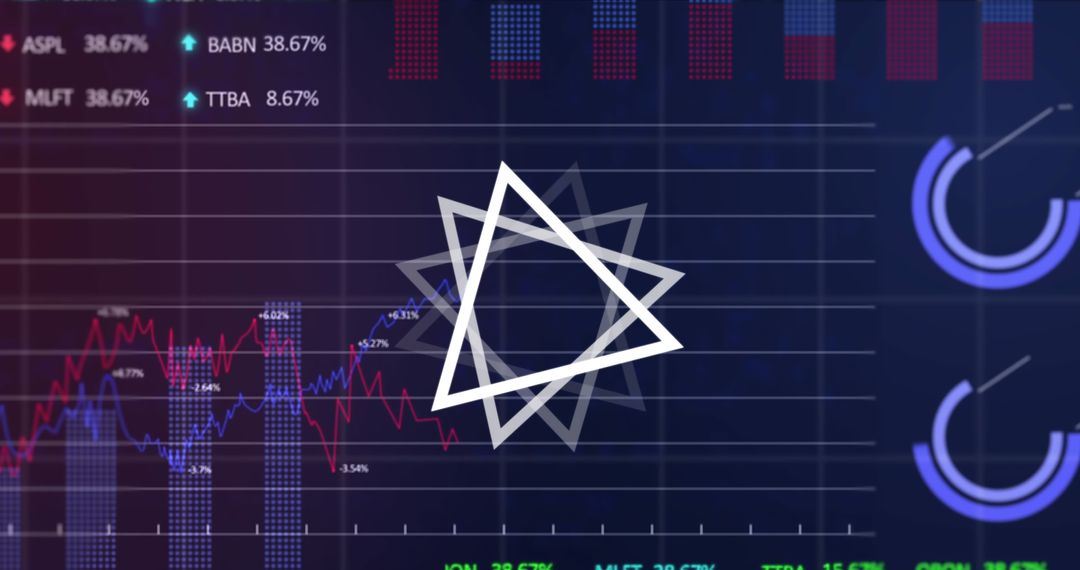
- Dynamic Stock Market Visualization on Digital Trading Board
Dynamic Stock Market Visualization on Digital Trading Board Image

Visual depicting a dynamic stock market interface combining graphs and data points on a digital trading board. Suggestive of growth, investment, and technology, this is ideal for illustrating financial reports, presentations on market analysis, and tech-driven economic solutions. It showcases modern market evaluation tools, making it suitable for business contexts and educational purposes highlighting trends and analytics.
Powered by  - Get 15% off with code: PIKWIZARD15


2
downloads
downloads
Tags:
More
Credit Photo
If you would like to credit the Photo, here are some ways you can do so
Text Link
photo Link
<span class="text-link">
<span>
<a target="_blank" href=https://pikwizard.com/photo/dynamic-stock-market-visualization-on-digital-trading-board/cbffb637c73ea15a745c347e0b24cff9/>PikWizard</a>
</span>
</span>
<span class="image-link">
<span
style="margin: 0 0 20px 0; display: inline-block; vertical-align: middle; width: 100%;"
>
<a
target="_blank"
href="https://pikwizard.com/photo/dynamic-stock-market-visualization-on-digital-trading-board/cbffb637c73ea15a745c347e0b24cff9/"
style="text-decoration: none; font-size: 10px; margin: 0;"
>
<img src="https://pikwizard.com/pw/medium/cbffb637c73ea15a745c347e0b24cff9.jpg" style="margin: 0; width: 100%;" alt="" />
<p style="font-size: 12px; margin: 0;">PikWizard</p>
</a>
</span>
</span>
Free (free of charge)
Free for personal and commercial use.
Author: Creative Art
Similar Free Stock Images

Premium


Premium


Premium


Premium


Premium


Premium


Premium


Premium


Premium


Premium


Premium


Premium


Premium


Premium


Premium


Premium


Premium


Premium


Premium


Premium


Premium


Premium


Premium


Premium