
- Home >
- Stock Photos >
- Dynamic Trading Screen with Candlestick Chart and Line Graphs
Dynamic Trading Screen with Candlestick Chart and Line Graphs Image
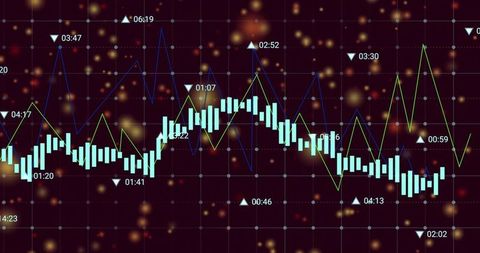
An engaging digital interface shows a trading screen combining candlestick charts and multi-colored line graphs, essential for financial analytics. Typically used in professional presentations or financial reports, it provides viewers with insights into stock market trends and dynamics. This imagery can enhance educational materials, financial blog illustrations, and investment strategy discussions.
Powered by  - Get 15% off with code: PIKWIZARD15


0
downloads
downloads
Tags:
More
Credit Photo
If you would like to credit the Photo, here are some ways you can do so
Text Link
photo Link
<span class="text-link">
<span>
<a target="_blank" href=https://pikwizard.com/photo/dynamic-trading-screen-with-candlestick-chart-and-line-graphs/54d08a9b1d45ee65957d6369f546034c/>PikWizard</a>
</span>
</span>
<span class="image-link">
<span
style="margin: 0 0 20px 0; display: inline-block; vertical-align: middle; width: 100%;"
>
<a
target="_blank"
href="https://pikwizard.com/photo/dynamic-trading-screen-with-candlestick-chart-and-line-graphs/54d08a9b1d45ee65957d6369f546034c/"
style="text-decoration: none; font-size: 10px; margin: 0;"
>
<img src="https://pikwizard.com/pw/medium/54d08a9b1d45ee65957d6369f546034c.jpg" style="margin: 0; width: 100%;" alt="" />
<p style="font-size: 12px; margin: 0;">PikWizard</p>
</a>
</span>
</span>
Free (free of charge)
Free for personal and commercial use.
Author: Authentic Images