
- Home >
- Stock Photos >
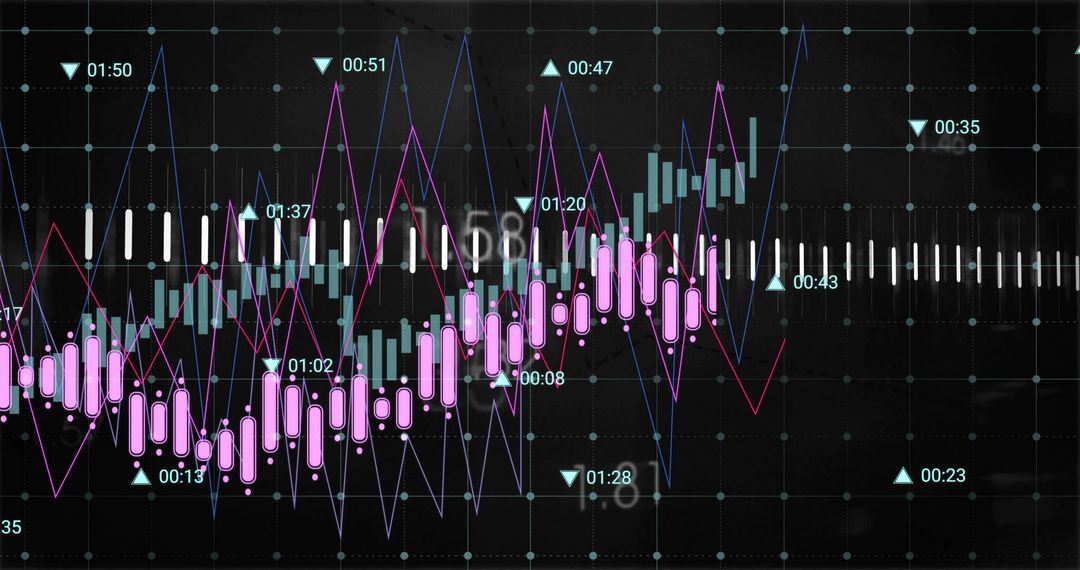
- Dynamic Waves Overlaying Financial Charts in Technological Design
Dynamic Waves Overlaying Financial Charts in Technological Design Image

Illustration of colorful wave-like patterns blending with financial charts, suggesting the merging of technology and finance. Perfect for presentations on global market trends, data analysis, and economic forecasts in a digital age. Can be used in technology-themed magazine articles or financial publications focusing on market dynamics or fintech advancements.
Powered by  - Get 15% off with code: PIKWIZARD15


2
downloads
downloads
Tags:
More
Credit Photo
If you would like to credit the Photo, here are some ways you can do so
Text Link
photo Link
<span class="text-link">
<span>
<a target="_blank" href=https://pikwizard.com/photo/dynamic-waves-overlaying-financial-charts-in-technological-design/d5b286fcd3b32878606b1d7f819dd6b1/>PikWizard</a>
</span>
</span>
<span class="image-link">
<span
style="margin: 0 0 20px 0; display: inline-block; vertical-align: middle; width: 100%;"
>
<a
target="_blank"
href="https://pikwizard.com/photo/dynamic-waves-overlaying-financial-charts-in-technological-design/d5b286fcd3b32878606b1d7f819dd6b1/"
style="text-decoration: none; font-size: 10px; margin: 0;"
>
<img src="https://pikwizard.com/pw/medium/d5b286fcd3b32878606b1d7f819dd6b1.jpg" style="margin: 0; width: 100%;" alt="" />
<p style="font-size: 12px; margin: 0;">PikWizard</p>
</a>
</span>
</span>
Free (free of charge)
Free for personal and commercial use.
Author: Awesome Content
Similar Free Stock Images

Premium


Premium


Premium


Premium


Premium


Premium


Premium


Premium


Premium


Premium


Premium


Premium


Premium


Premium


Premium


Premium


Premium


Premium


Premium


Premium


Premium


Premium


Premium


Premium

