
- Home >
- Stock Photos >
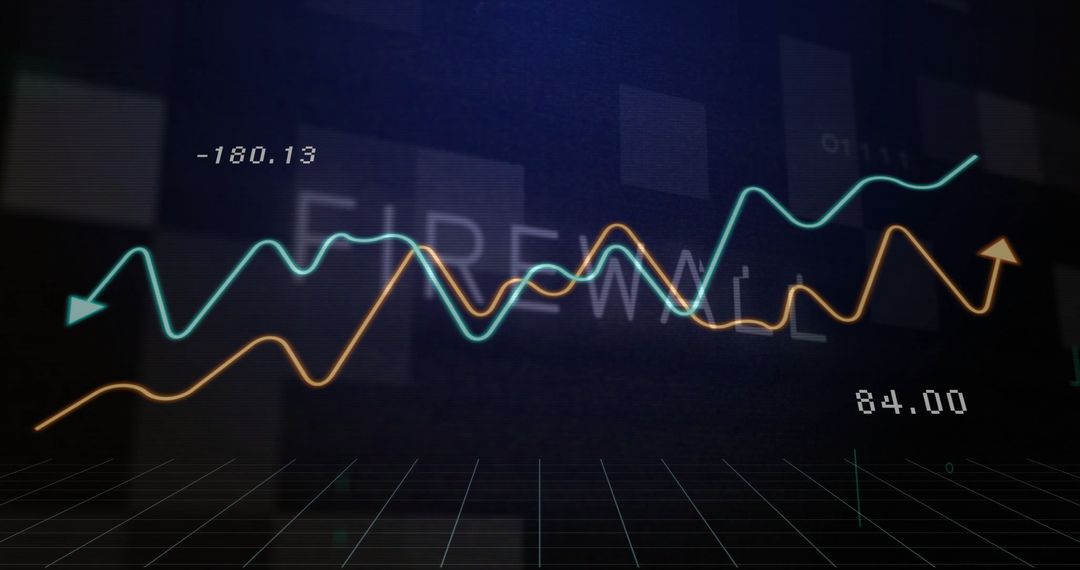
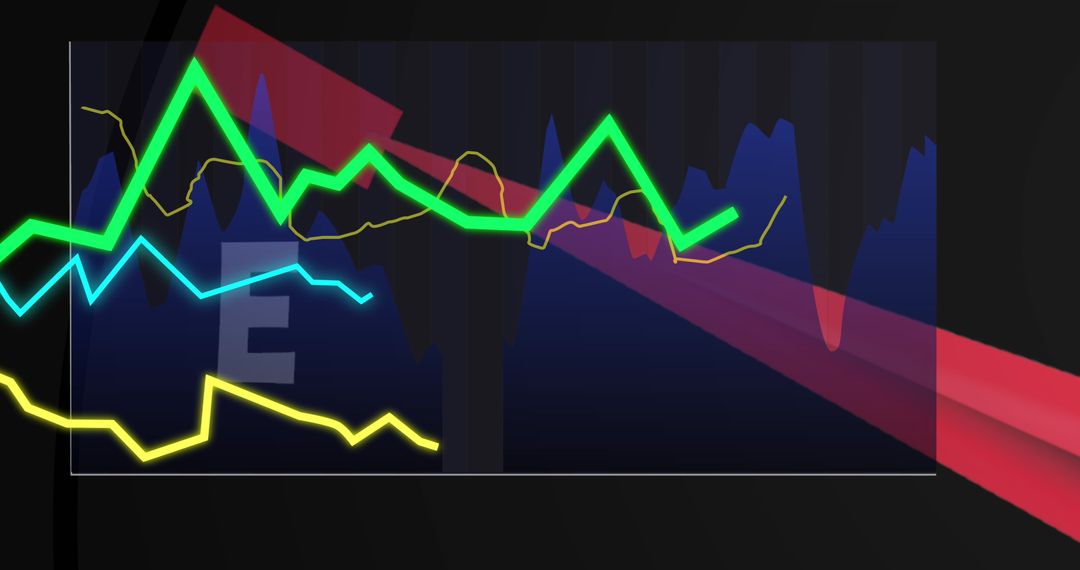
- Economic Decline Illustrated with Chart and Red Arrow
Economic Decline Illustrated with Chart and Red Arrow Image

Digital representation of economic decline with financial chart using blue bars and fluctuating line graphs alongside a prominent downward red arrow. Useful for financial forecasts, investment trends, market analysis, economic presentations, and reports on financial instability.
Powered by  - Get 15% off with code: PIKWIZARD15


0
downloads
downloads
Tags:
More
Credit Photo
If you would like to credit the Photo, here are some ways you can do so
Text Link
photo Link
<span class="text-link">
<span>
<a target="_blank" href=https://pikwizard.com/photo/economic-decline-illustrated-with-chart-and-red-arrow/443b3c5fca3c8646db877ee0ac4623dd/>PikWizard</a>
</span>
</span>
<span class="image-link">
<span
style="margin: 0 0 20px 0; display: inline-block; vertical-align: middle; width: 100%;"
>
<a
target="_blank"
href="https://pikwizard.com/photo/economic-decline-illustrated-with-chart-and-red-arrow/443b3c5fca3c8646db877ee0ac4623dd/"
style="text-decoration: none; font-size: 10px; margin: 0;"
>
<img src="https://pikwizard.com/pw/medium/443b3c5fca3c8646db877ee0ac4623dd.jpg" style="margin: 0; width: 100%;" alt="" />
<p style="font-size: 12px; margin: 0;">PikWizard</p>
</a>
</span>
</span>
Free (free of charge)
Free for personal and commercial use.
Author: Awesome Content
Similar Free Stock Images

Premium


Premium


Premium


Premium


Premium


Premium


Premium


Premium


Premium


Premium


Premium


Premium


Premium


Premium


Premium


Premium


Premium


Premium


Premium


Premium


Premium


Premium


Premium


Premium

