- Home >
- Stock Photos >
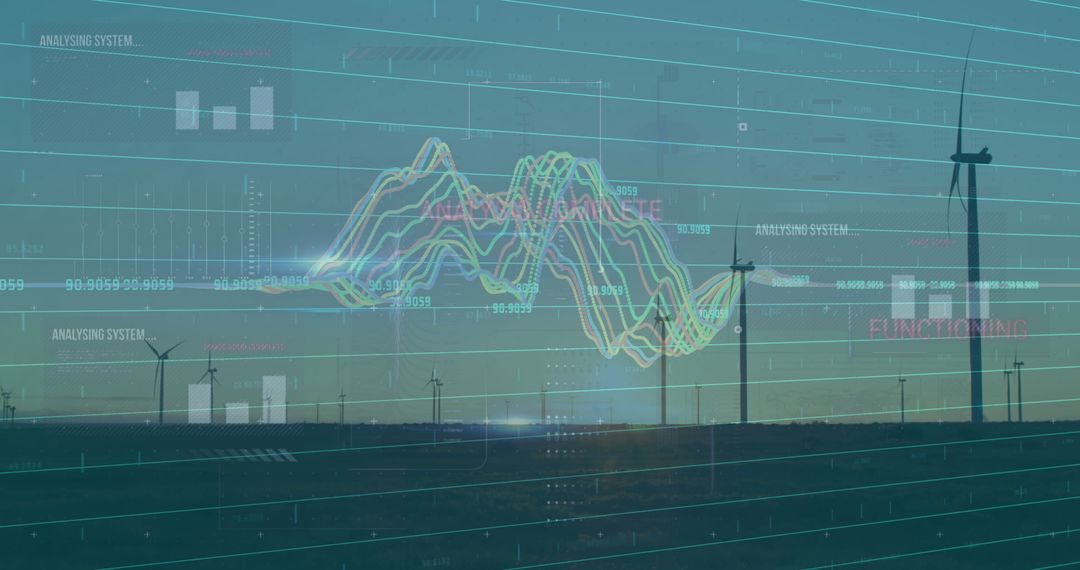
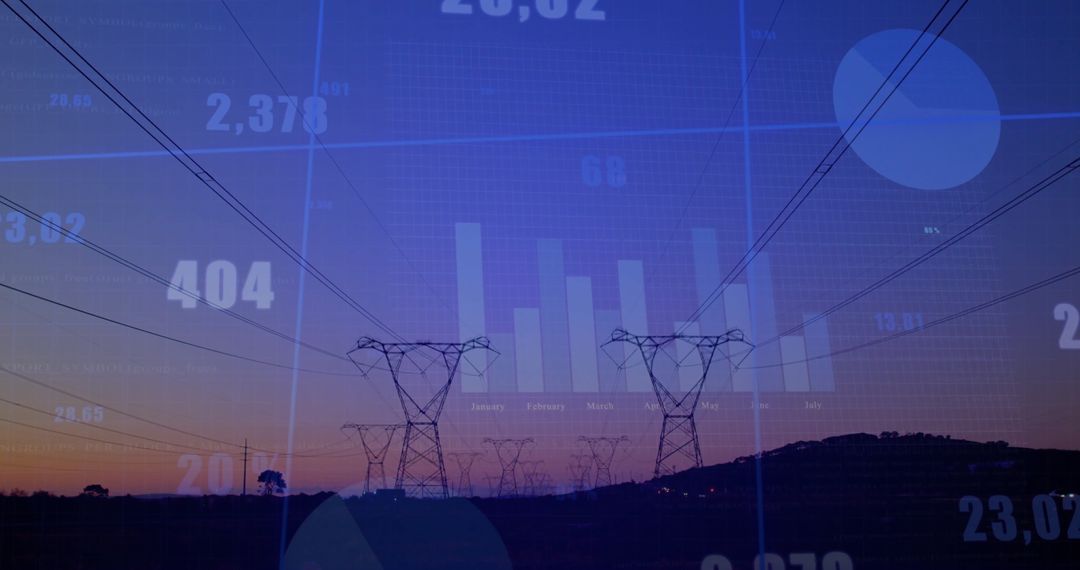
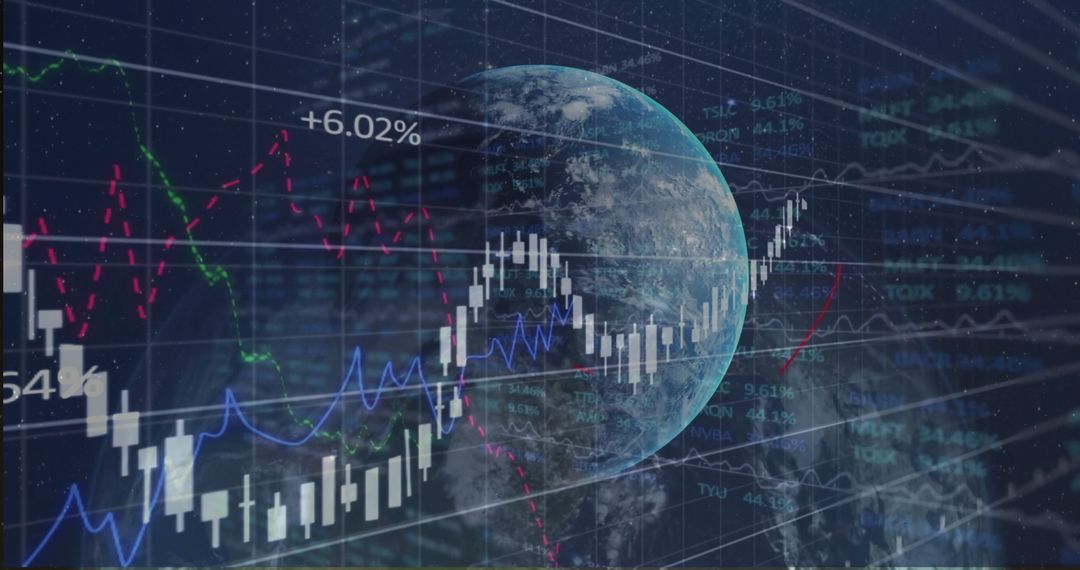
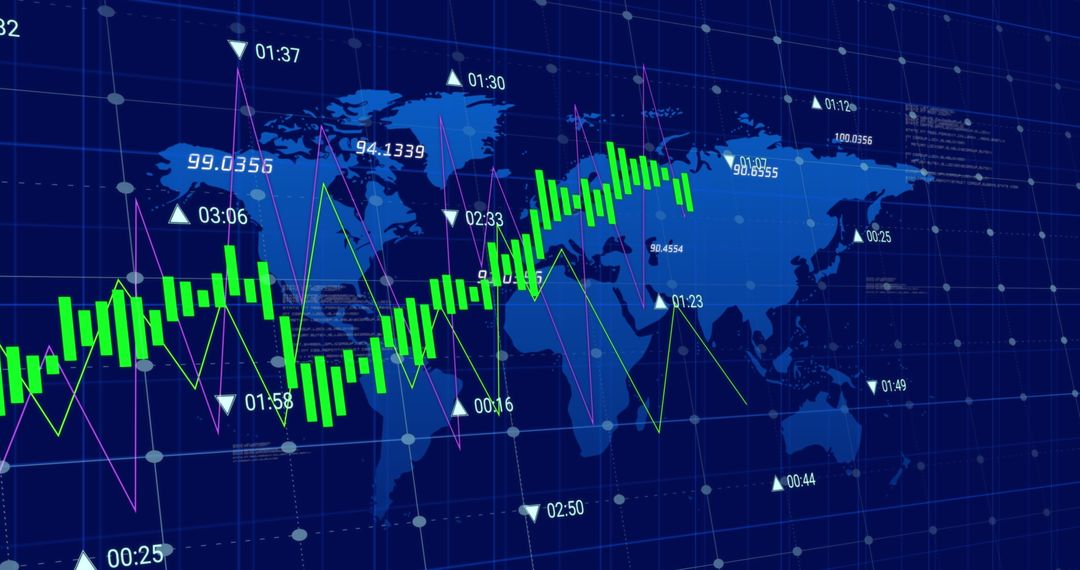
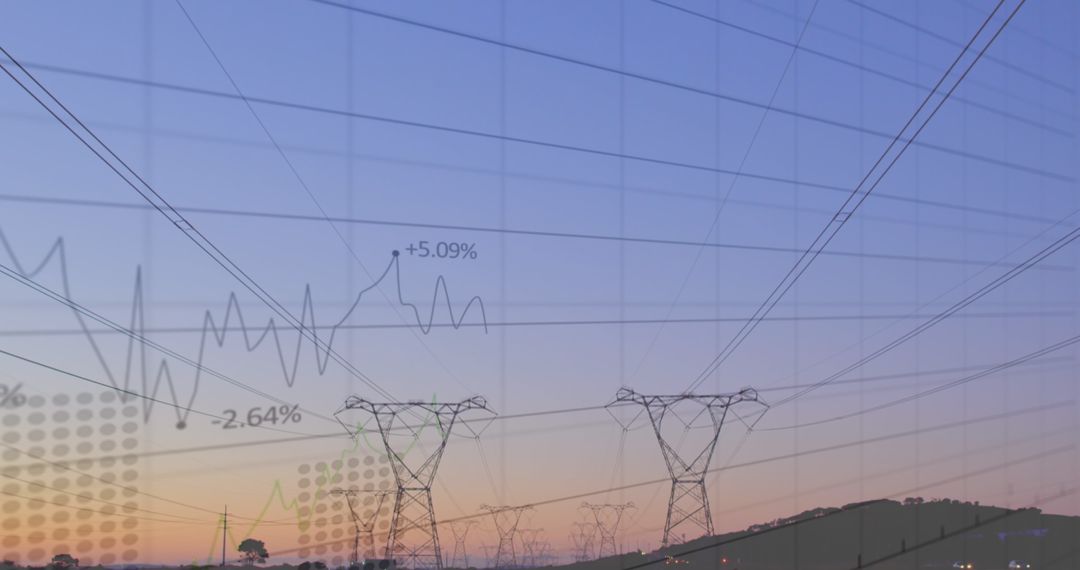
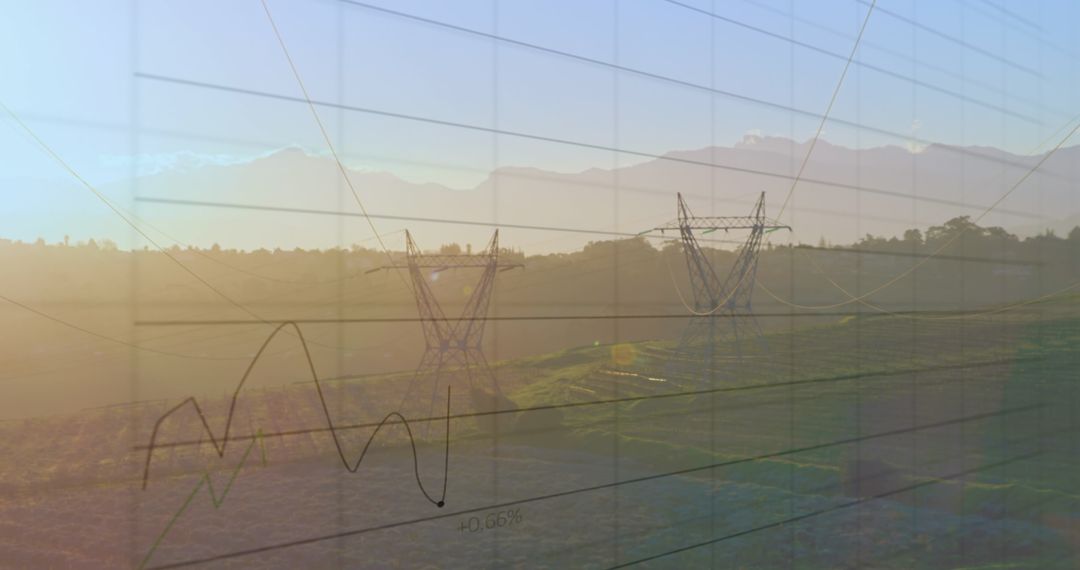
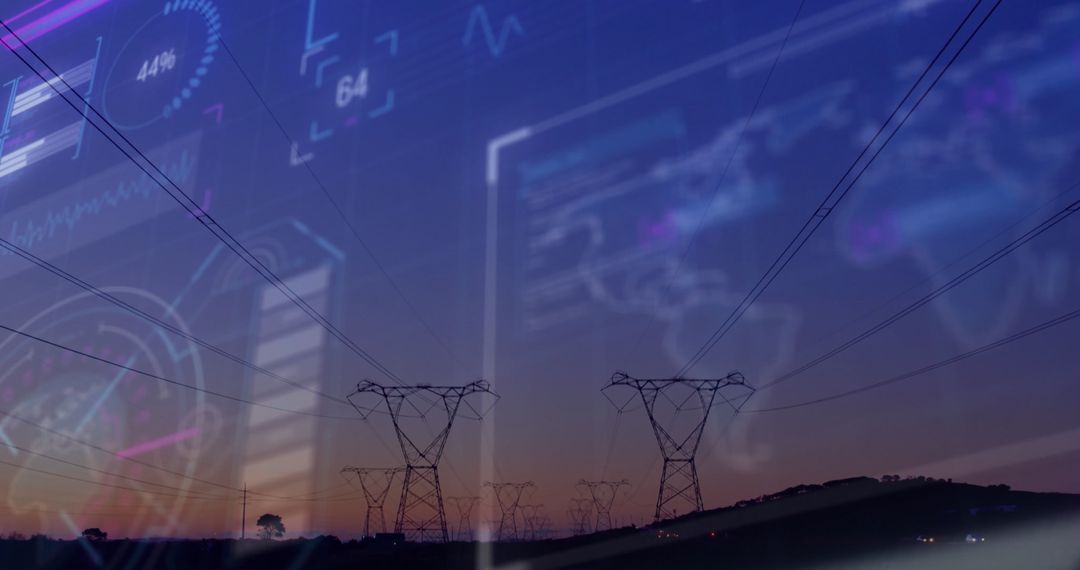
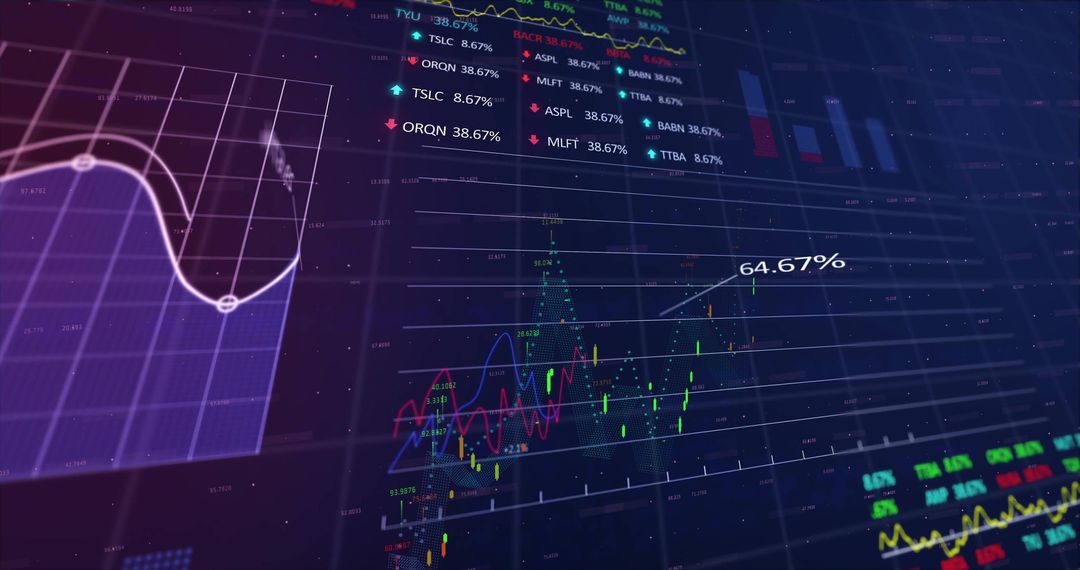
- Energy and Finance Analysis at Dusk with Overlaid Data Visualization
Energy and Finance Analysis at Dusk with Overlaid Data Visualization Image
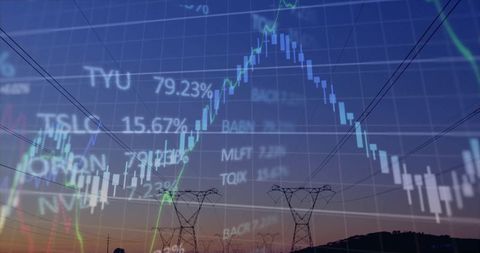
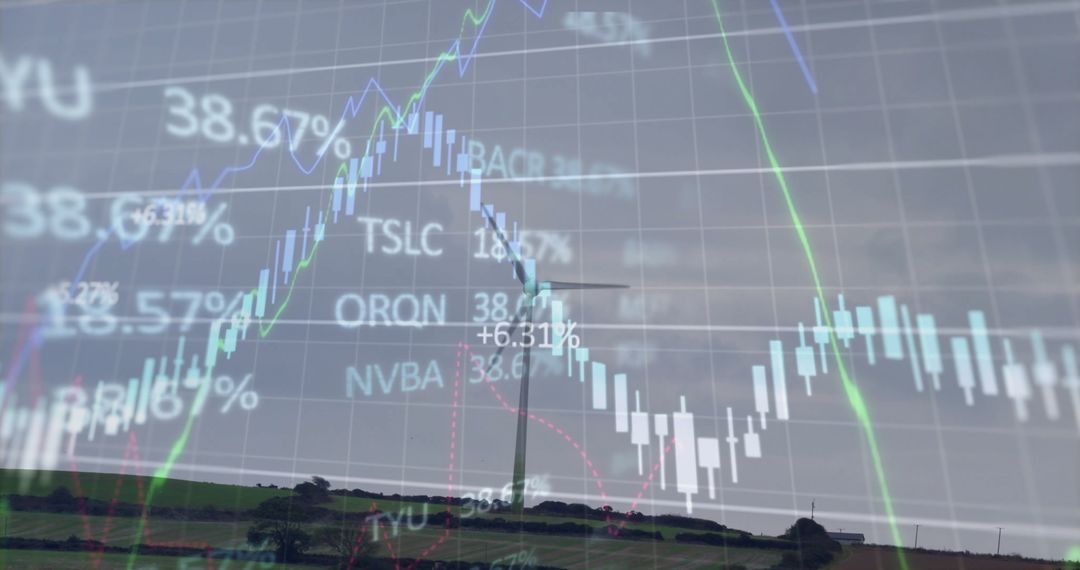
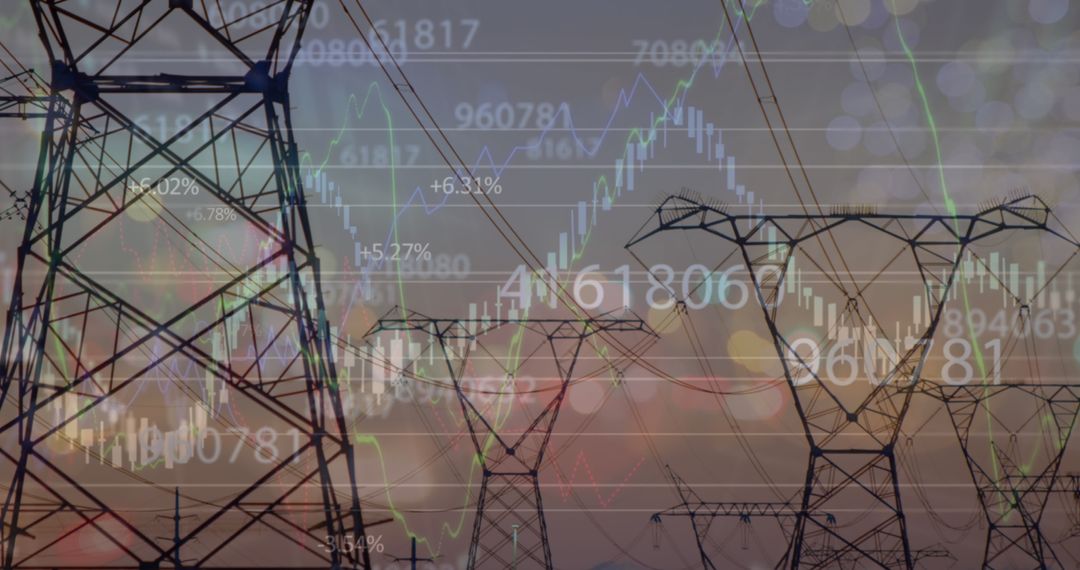
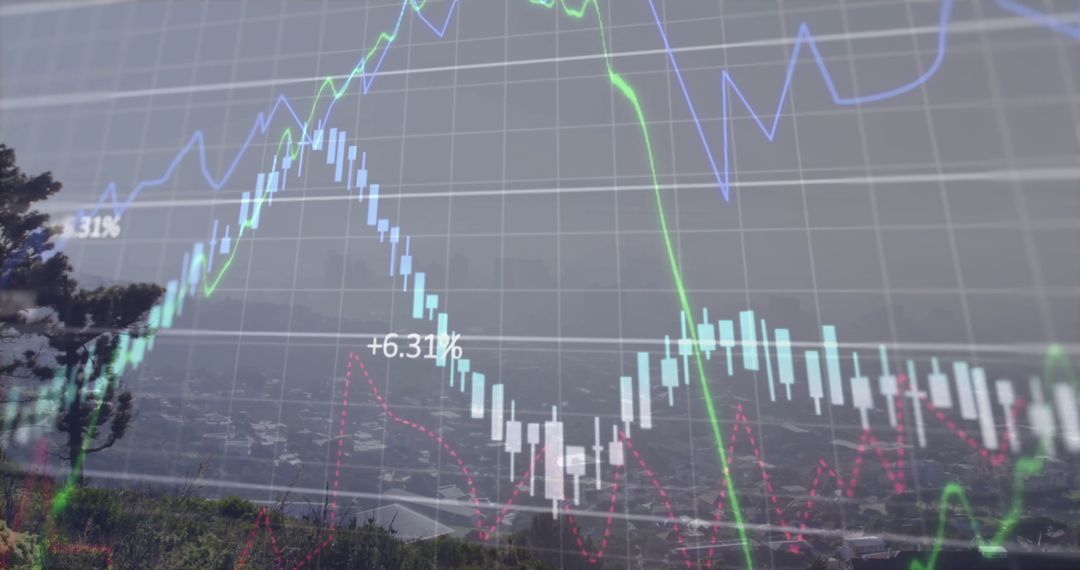
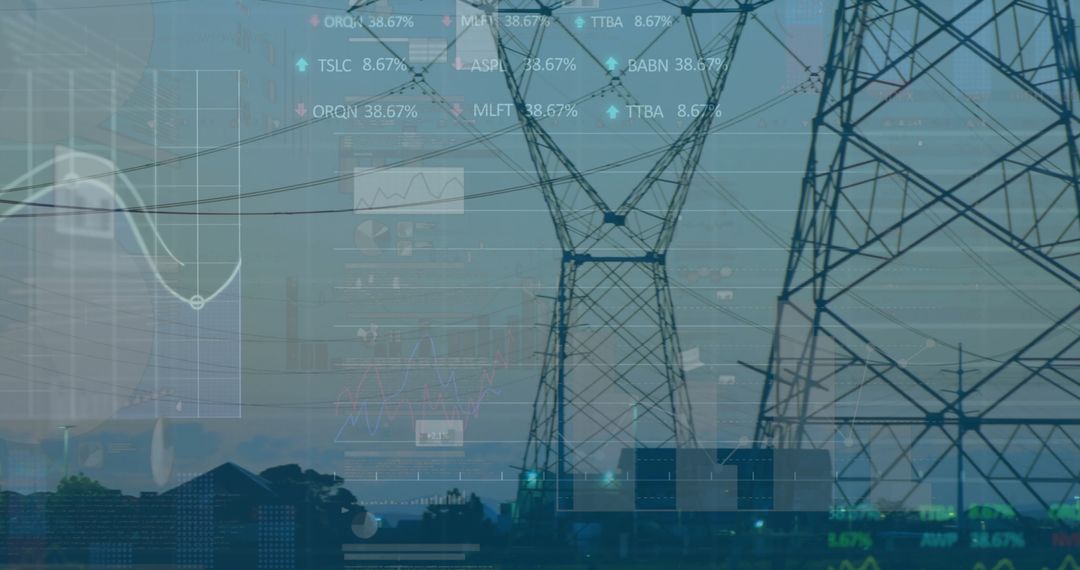
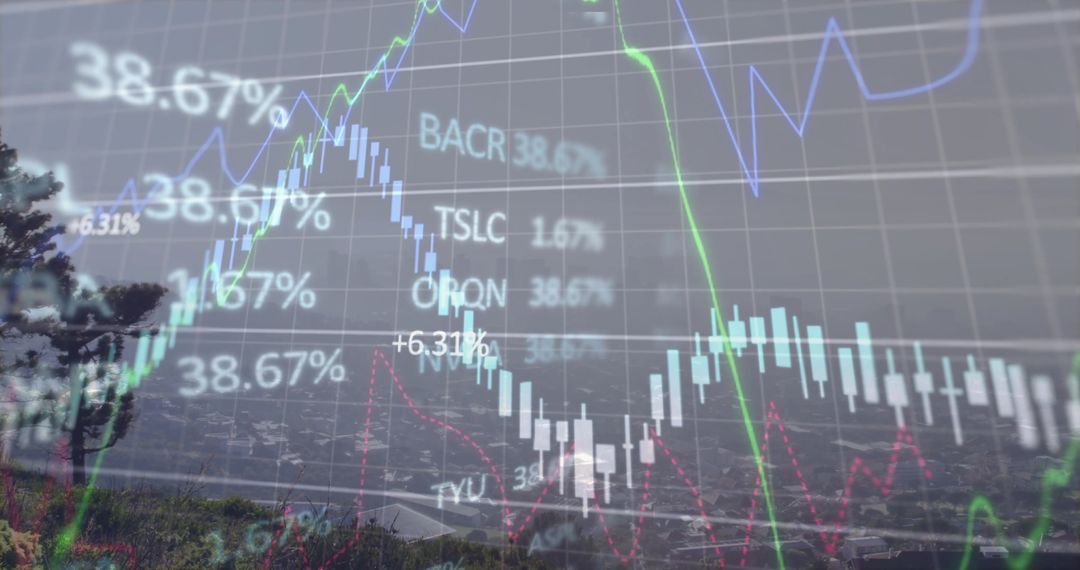
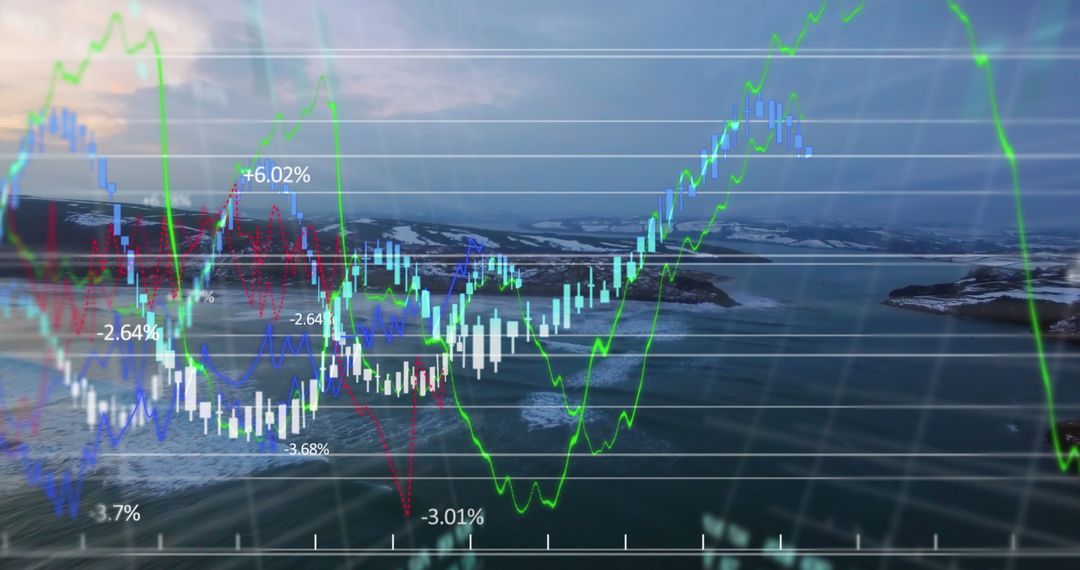
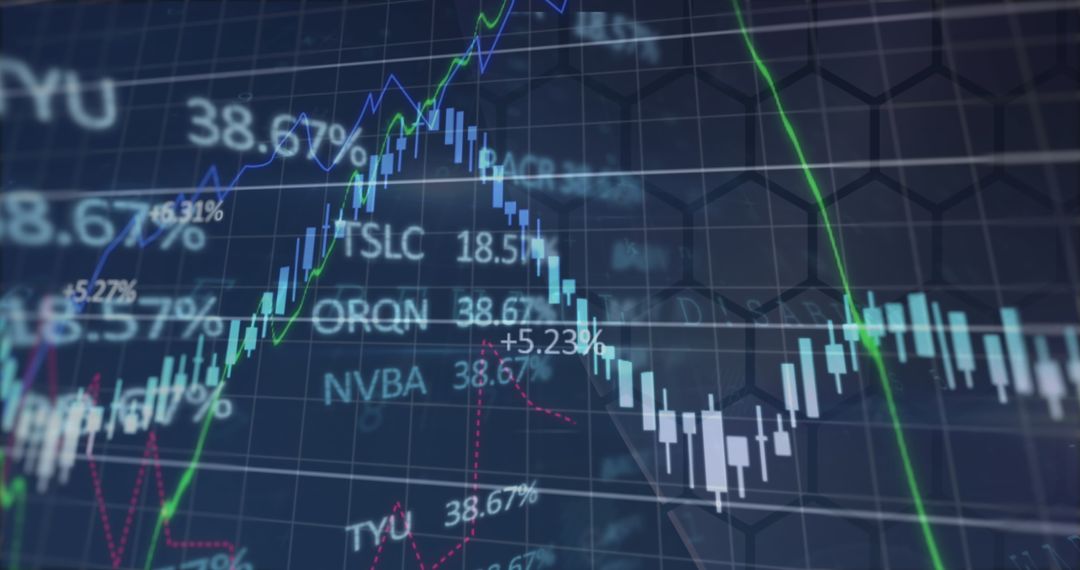
This image portrays power transmission towers and lines set against a twilight sky, creatively merged with candlestick chart patterns and stock ticker symbols. The combination of elements signifies a connection between the energy industry and financial markets, illustrating themes of energy investment, technological integration, and the economy's impact on sustainability. This composition could be used by publications focused on energy markets, financial research, techno-financial innovation, or worldwide infrastructure development discussions. It also suits marketing materials for businesses in renewable energy, finance, technology insights, or industrial strategy analysis.
Powered by 


0
downloads
downloads
Tags:
More
Credit Photo
If you would like to credit the Photo, here are some ways you can do so
Text Link
photo Link
<span class="text-link">
<span>
<a target="_blank" href=https://pikwizard.com/photo/energy-and-finance-analysis-at-dusk-with-overlaid-data-visualization/9035c0431723d05850769f1596cc8300/>PikWizard</a>
</span>
</span>
<span class="image-link">
<span
style="margin: 0 0 20px 0; display: inline-block; vertical-align: middle; width: 100%;"
>
<a
target="_blank"
href="https://pikwizard.com/photo/energy-and-finance-analysis-at-dusk-with-overlaid-data-visualization/9035c0431723d05850769f1596cc8300/"
style="text-decoration: none; font-size: 10px; margin: 0;"
>
<img src="https://pikwizard.com/pw/medium/9035c0431723d05850769f1596cc8300.jpg" style="margin: 0; width: 100%;" alt="" />
<p style="font-size: 12px; margin: 0;">PikWizard</p>
</a>
</span>
</span>
Free (free of charge)
Free for personal and commercial use.
Author: Creative Art
Similar Free Stock Images
Premium


Premium


Premium


Premium


Premium


Premium


Premium


Premium


Premium


Premium


Premium


Premium


Premium


Premium


Premium


Premium


Premium


Premium


Premium


Premium


Premium


Premium


Premium


Premium