- Home >
- Stock Photos >
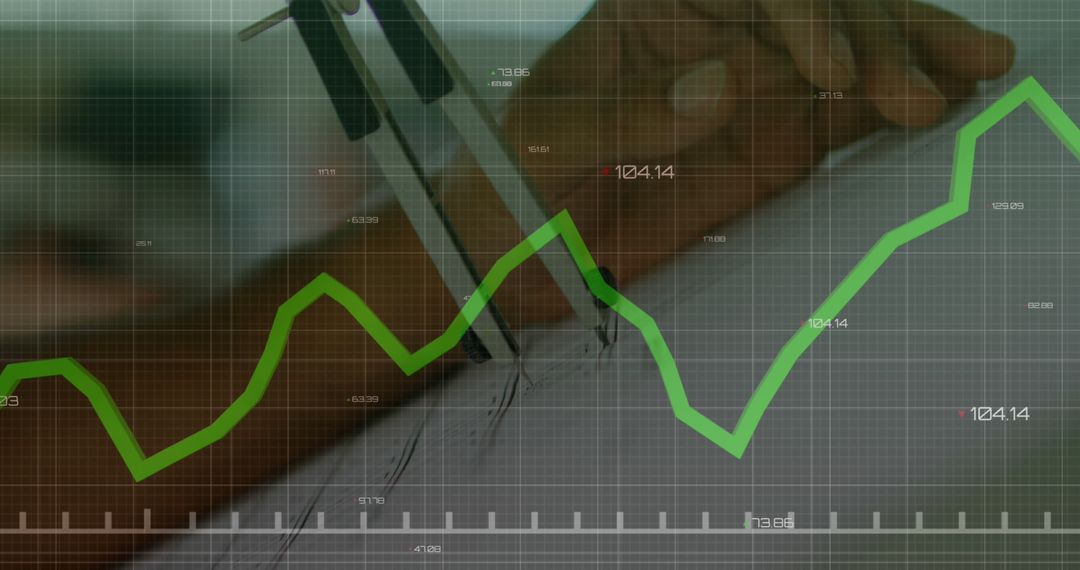
- Examining Financial Data with Magnifying Glass Close-Up
Examining Financial Data with Magnifying Glass Close-Up Image

This visually engaging scene illustrates in-depth financial analysis as a magnifying glass zooms in on intricate stock market data and graphs. Useful for depicting financial services, business technology interfaces, and market analysis studies, it emphasizes precision and focus on trending economic patterns. Ideal for financial articles, business presentations, and digital innovation showcases.
Powered by 


2
downloads
downloads
Tags:
More
Credit Photo
If you would like to credit the Photo, here are some ways you can do so
Text Link
photo Link
<span class="text-link">
<span>
<a target="_blank" href=https://pikwizard.com/photo/examining-financial-data-with-magnifying-glass-close-up/f405ba7b08a9c866c8263187ffd1f420/>PikWizard</a>
</span>
</span>
<span class="image-link">
<span
style="margin: 0 0 20px 0; display: inline-block; vertical-align: middle; width: 100%;"
>
<a
target="_blank"
href="https://pikwizard.com/photo/examining-financial-data-with-magnifying-glass-close-up/f405ba7b08a9c866c8263187ffd1f420/"
style="text-decoration: none; font-size: 10px; margin: 0;"
>
<img src="https://pikwizard.com/pw/medium/f405ba7b08a9c866c8263187ffd1f420.jpg" style="margin: 0; width: 100%;" alt="" />
<p style="font-size: 12px; margin: 0;">PikWizard</p>
</a>
</span>
</span>
Free (free of charge)
Free for personal and commercial use.
Author: Awesome Content
Similar Free Stock Images

Premium


Premium


Premium


Premium


Premium


Premium


Premium


Premium


Premium


Premium


Premium


Premium


Premium


Premium


Premium


Premium


Premium


Premium


Premium


Premium


Premium


Premium


Premium


Premium