- Home >
- Stock Photos >
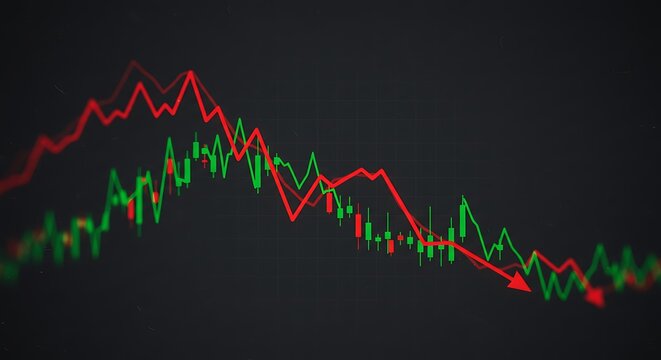
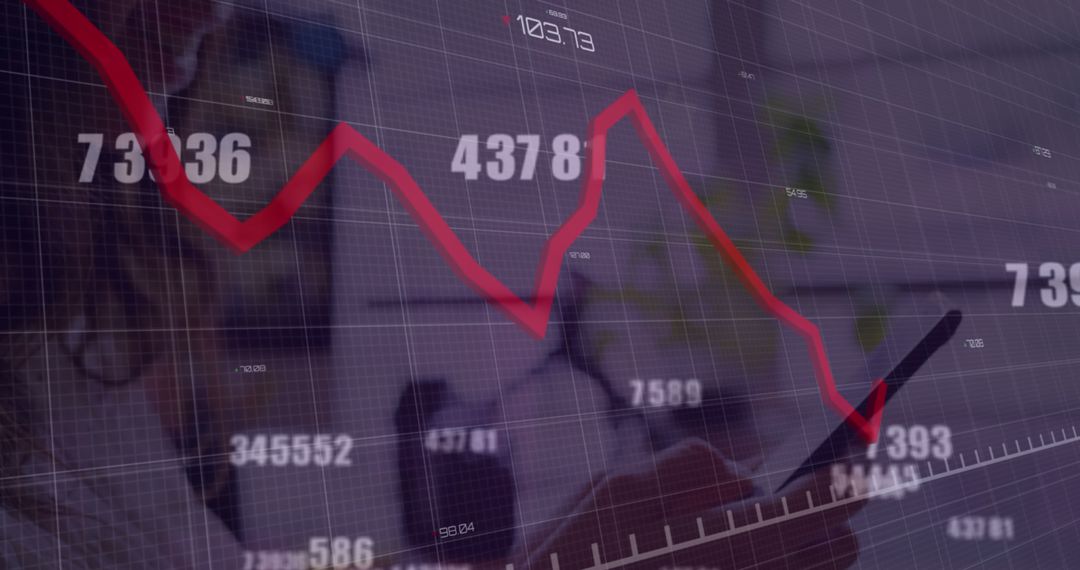
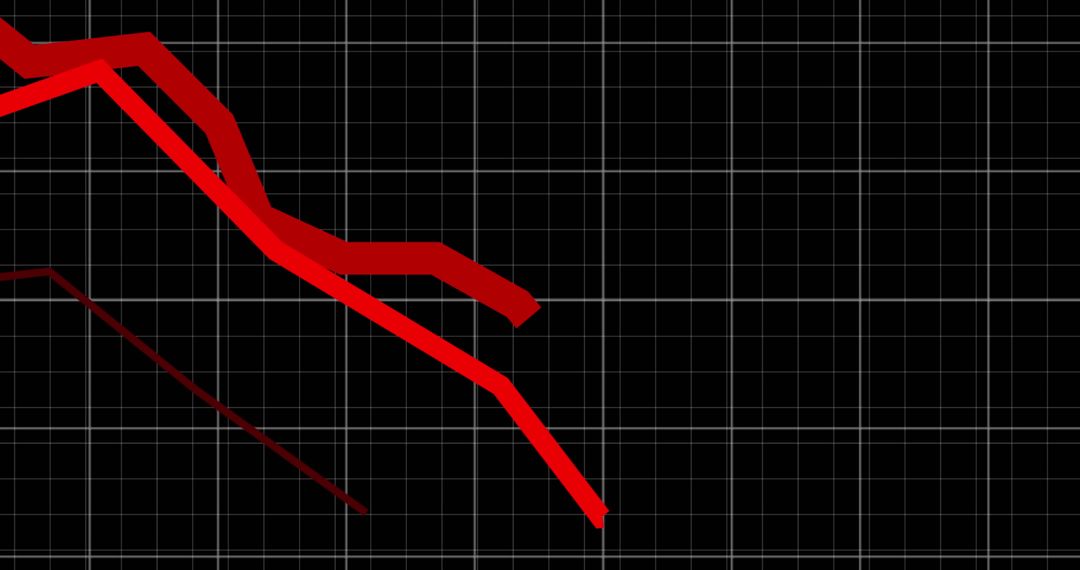
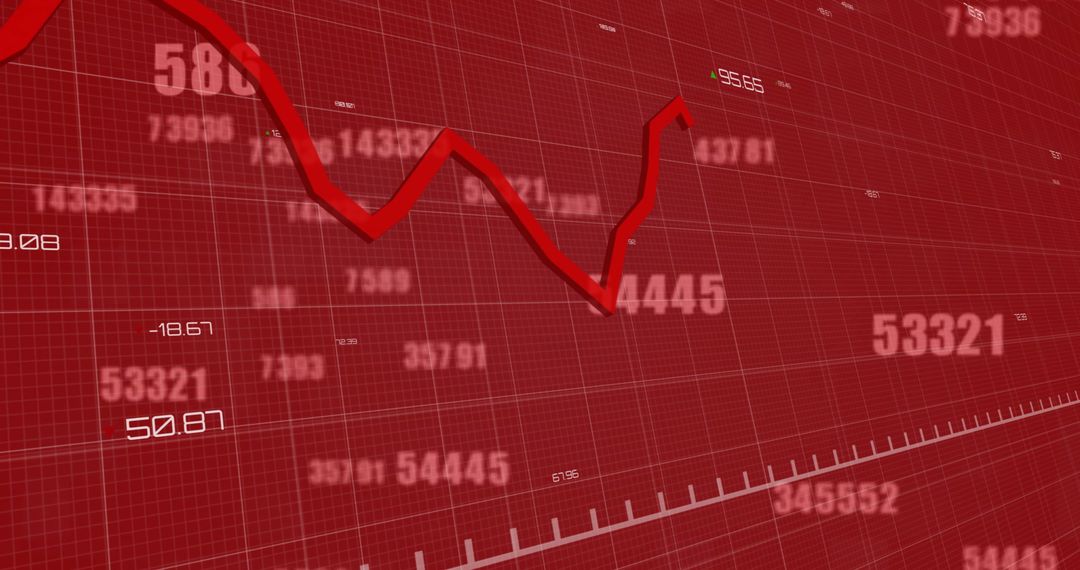
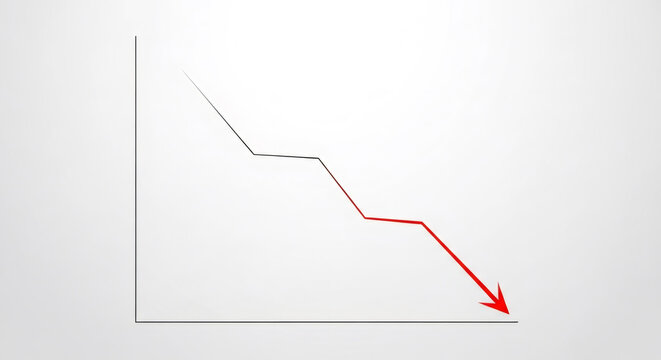
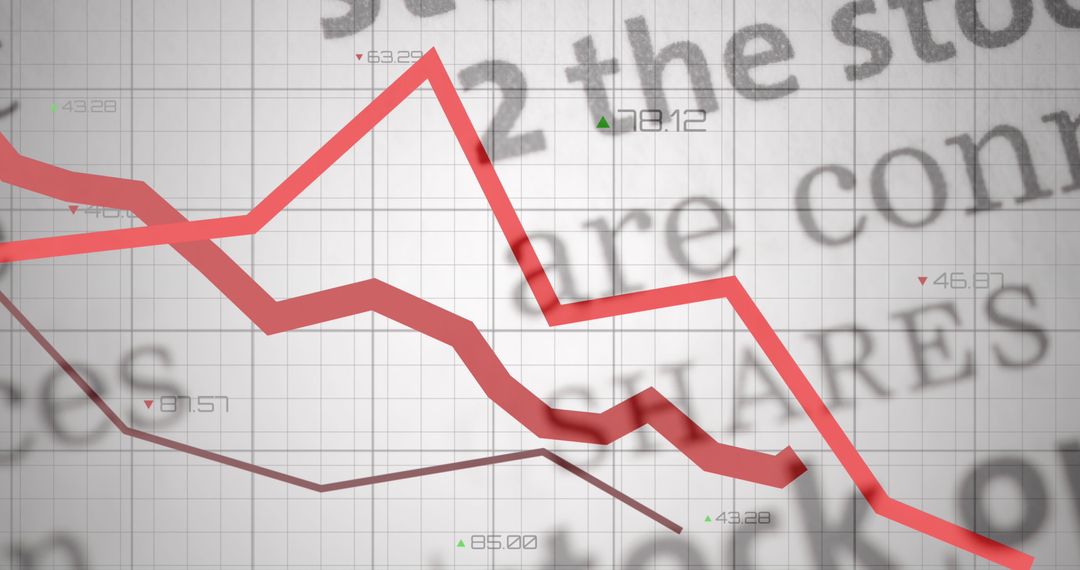
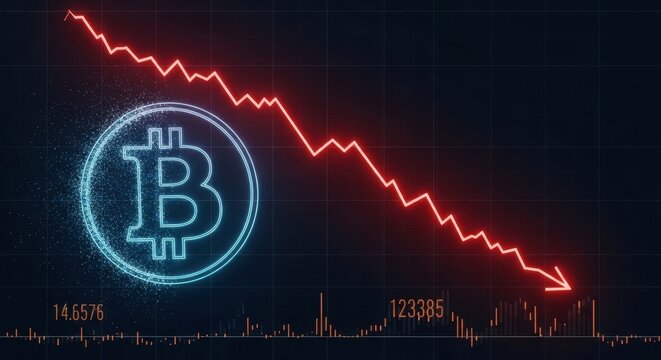
- Falling Stock Market with Red Downward Graph and Numbers
Falling Stock Market with Red Downward Graph and Numbers Image
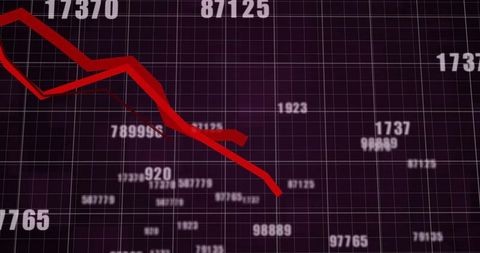
Graph shows decline in financial metrics with key metrics and red downward trajectory. Visualizes downturn in stock market or financial crisis effect. Ideal for use in financial news articles, economic reports, business presentations, or blog content related to marketplace downturn concerns.
Powered by 


2
downloads
downloads
Tags:
More
Credit Photo
If you would like to credit the Photo, here are some ways you can do so
Text Link
photo Link
<span class="text-link">
<span>
<a target="_blank" href=https://pikwizard.com/photo/falling-stock-market-with-red-downward-graph-and-numbers/b5c3edb10560ba69bd8df3eb48c1a58a/>PikWizard</a>
</span>
</span>
<span class="image-link">
<span
style="margin: 0 0 20px 0; display: inline-block; vertical-align: middle; width: 100%;"
>
<a
target="_blank"
href="https://pikwizard.com/photo/falling-stock-market-with-red-downward-graph-and-numbers/b5c3edb10560ba69bd8df3eb48c1a58a/"
style="text-decoration: none; font-size: 10px; margin: 0;"
>
<img src="https://pikwizard.com/pw/medium/b5c3edb10560ba69bd8df3eb48c1a58a.jpg" style="margin: 0; width: 100%;" alt="" />
<p style="font-size: 12px; margin: 0;">PikWizard</p>
</a>
</span>
</span>
Free (free of charge)
Free for personal and commercial use.
Author: People Creations
Similar Free Stock Images

Premium


Premium


Premium


Premium


Premium


Premium


Premium


Premium


Premium


Premium


Premium


Premium


Premium


Premium


Premium


Premium


Premium


Premium


Premium


Premium


Premium


Premium


Premium


Premium