- Home >
- Stock Photos >
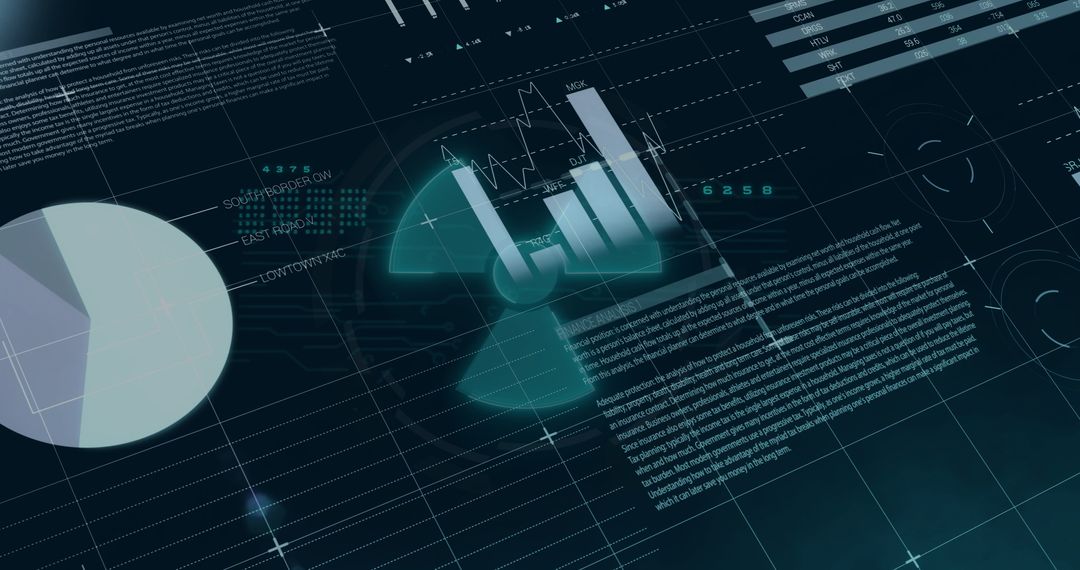
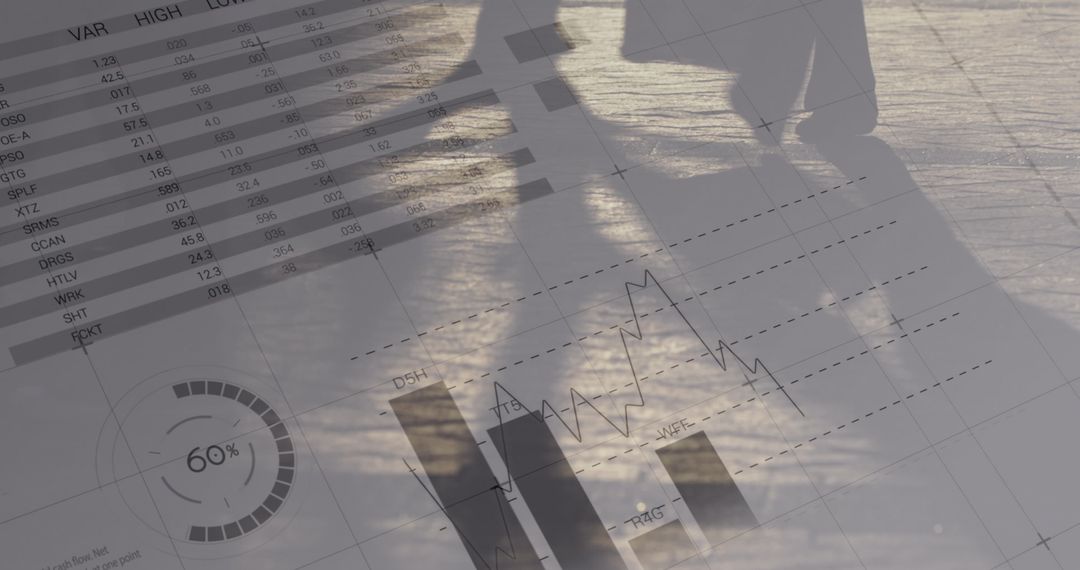
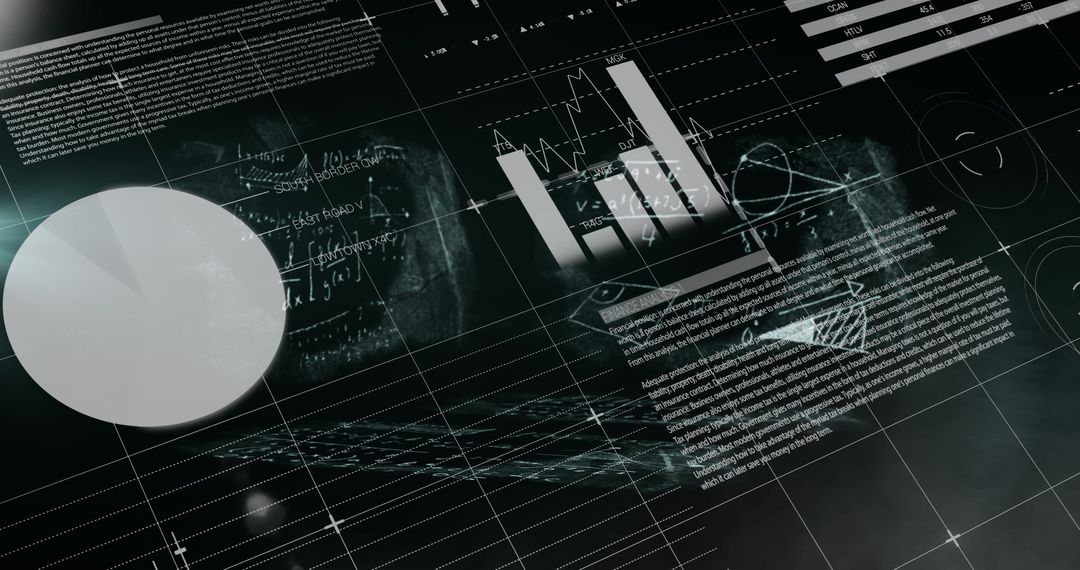
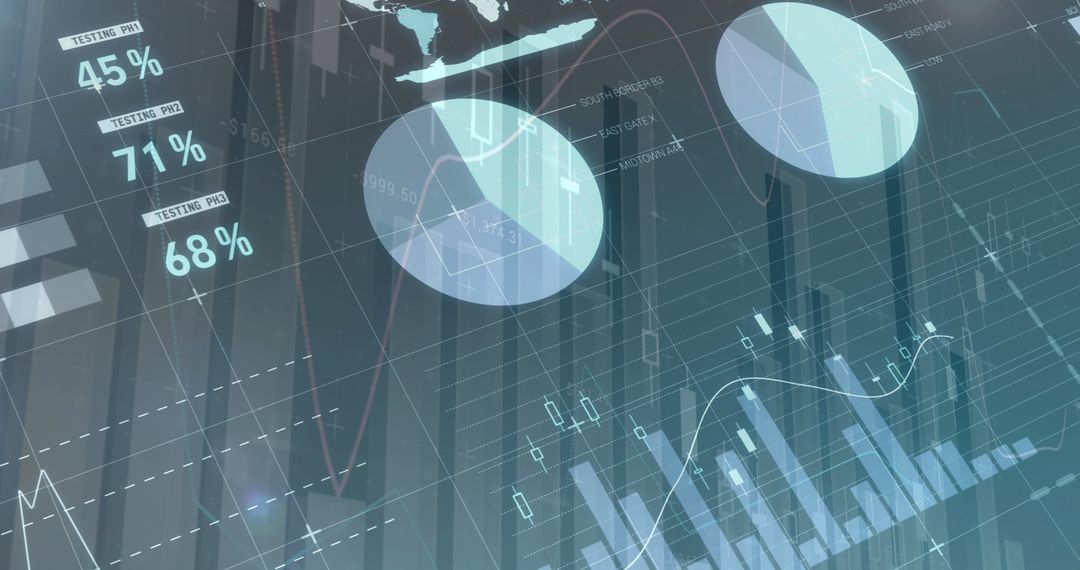
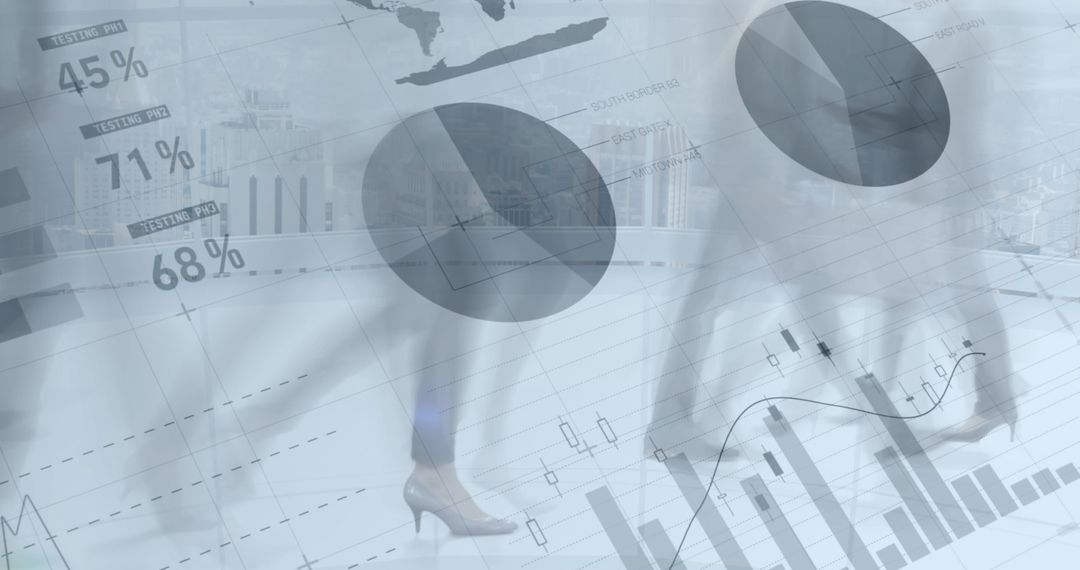
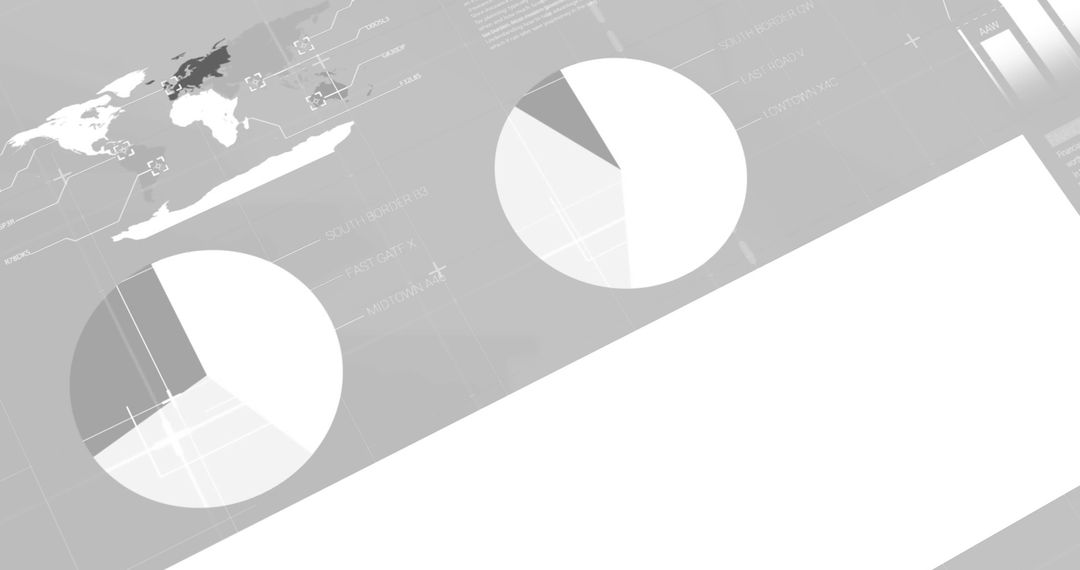
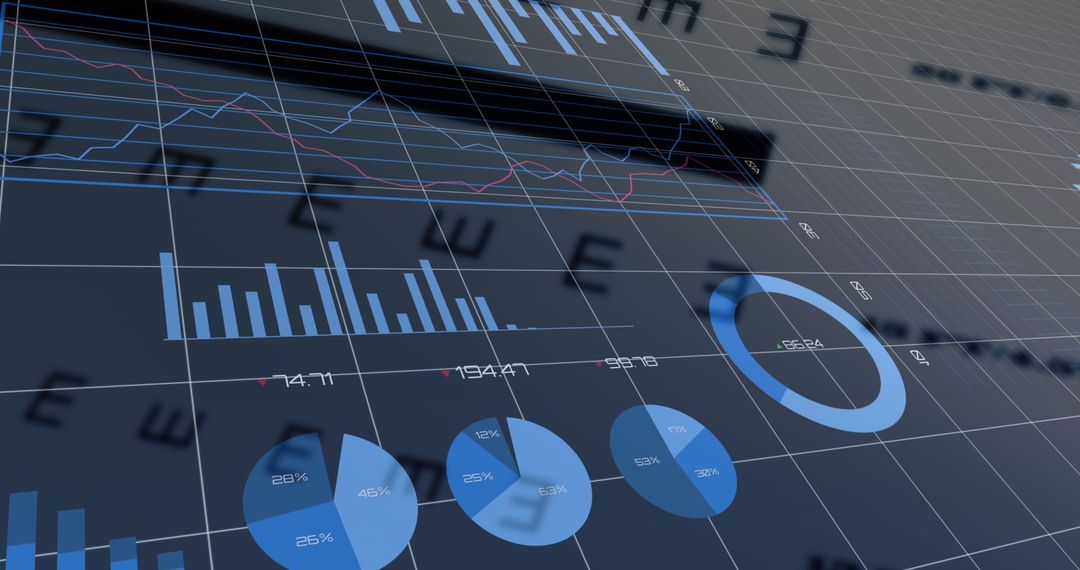
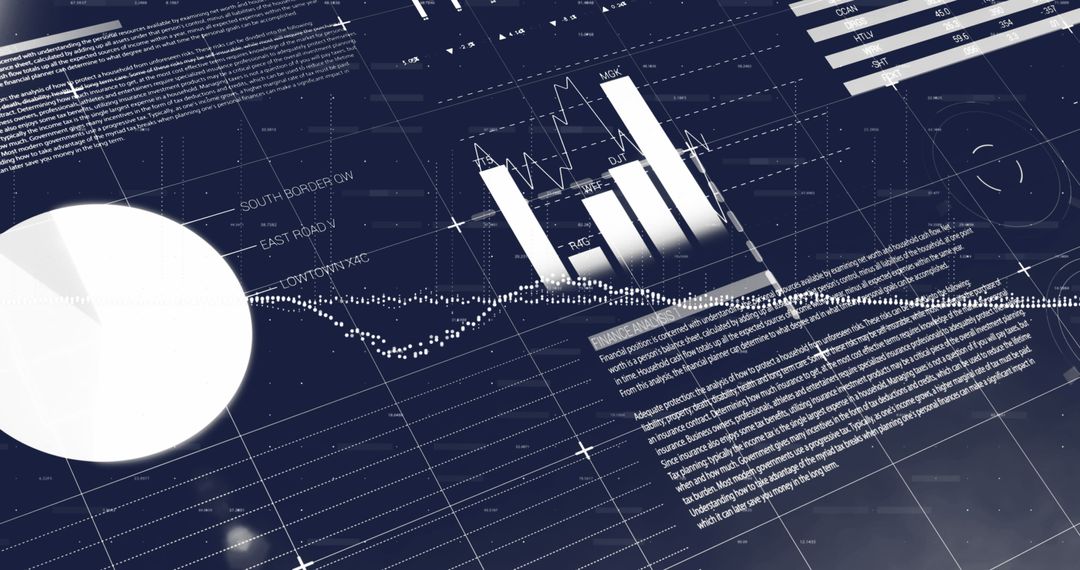
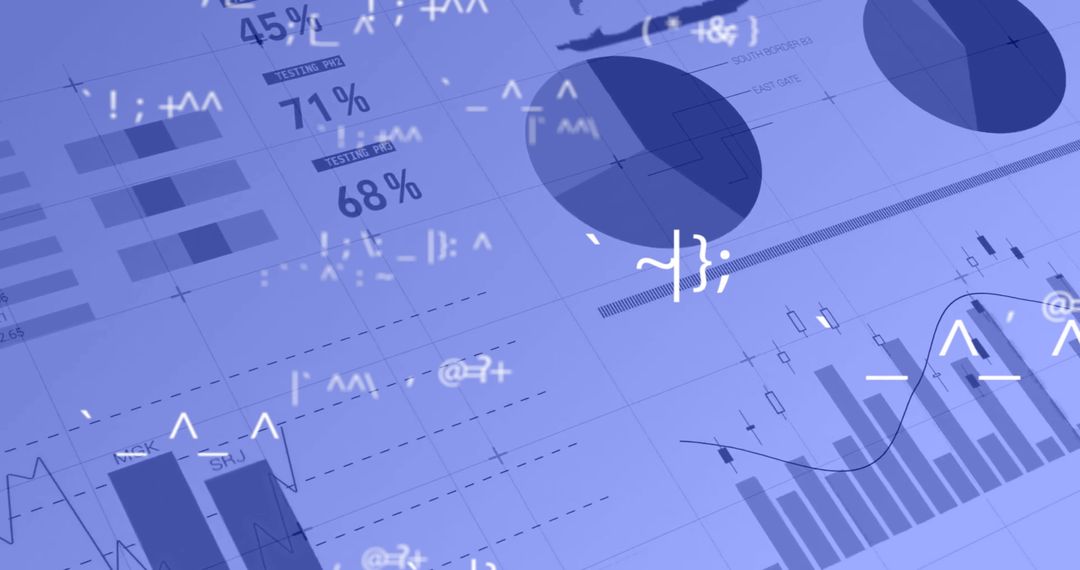
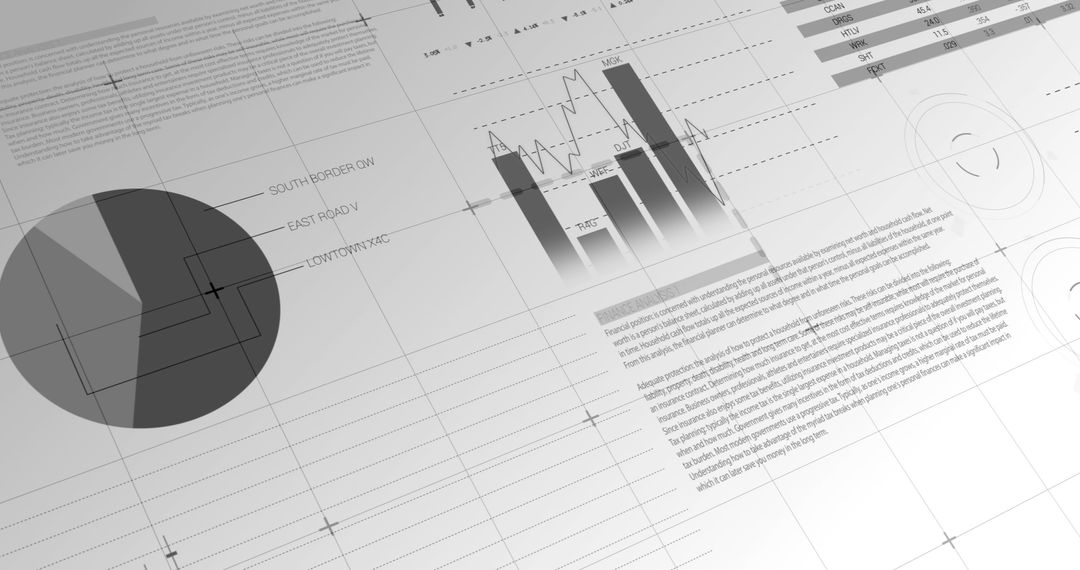
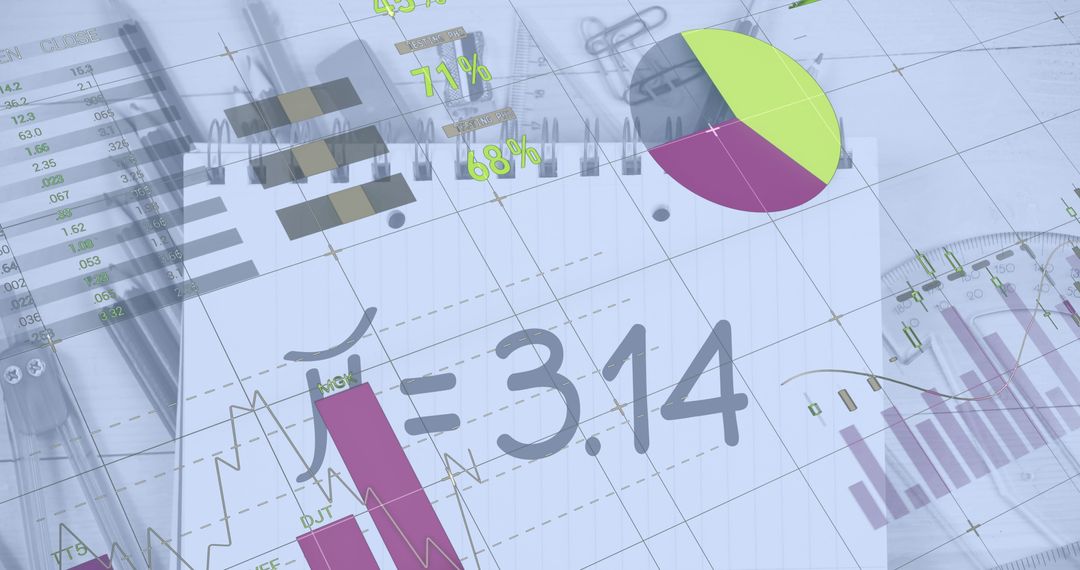
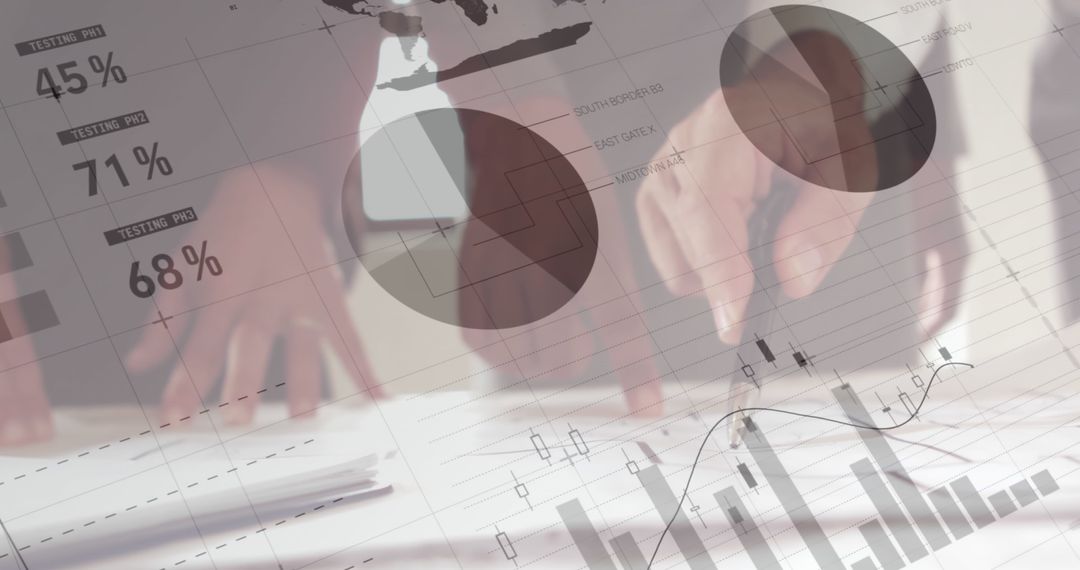
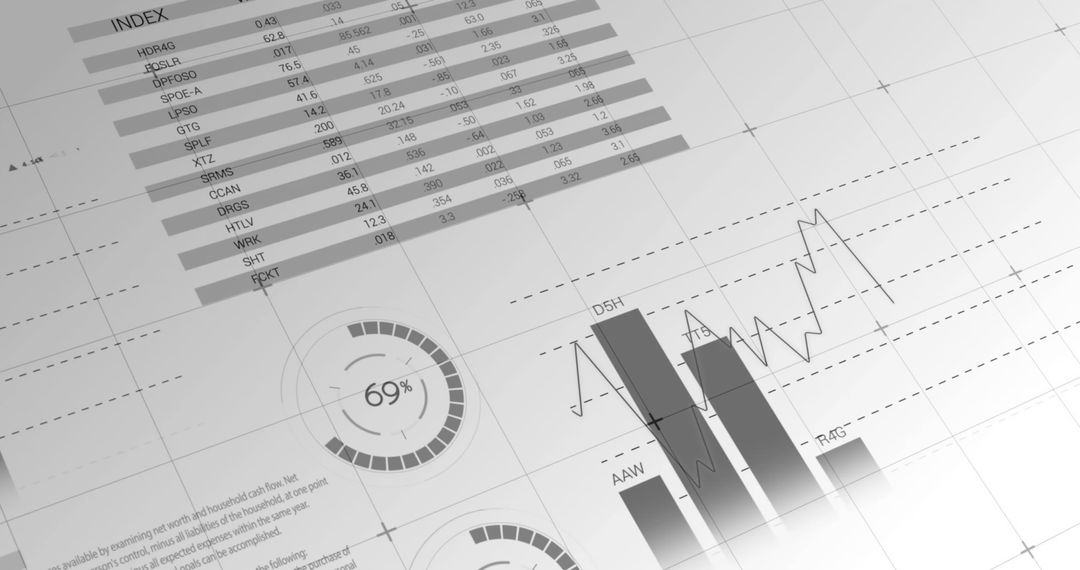
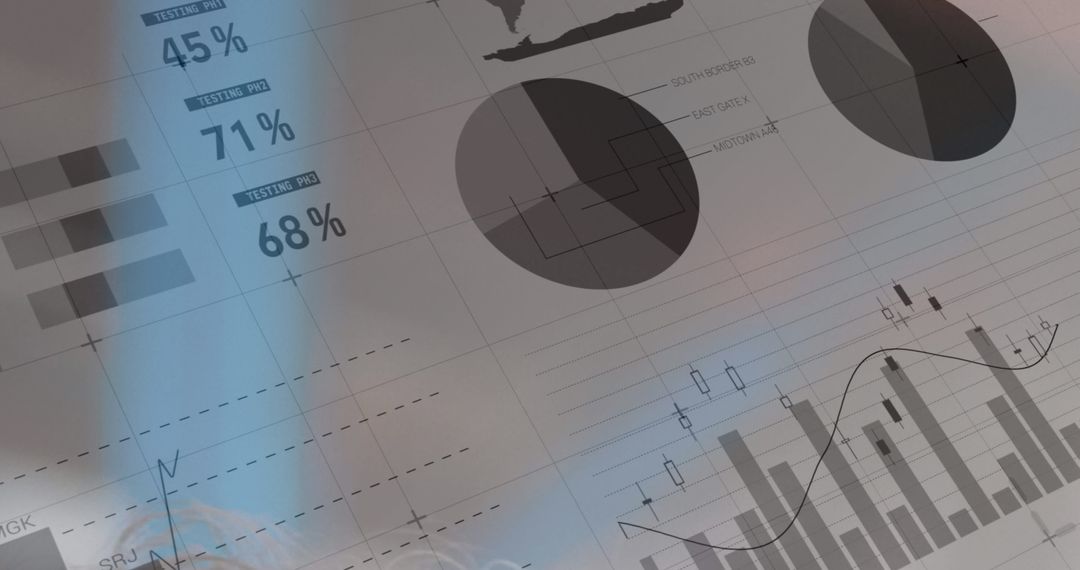
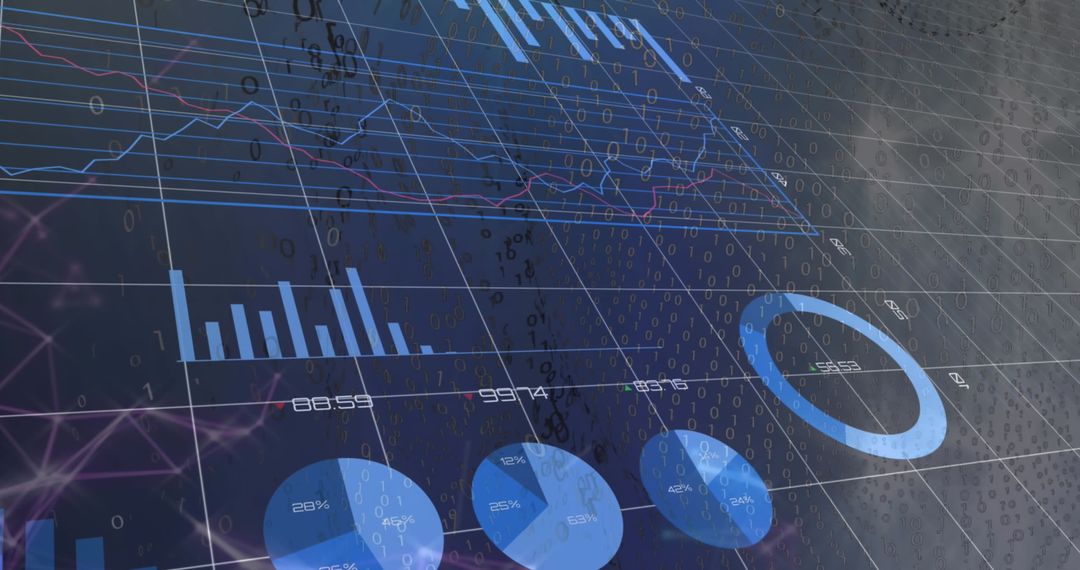
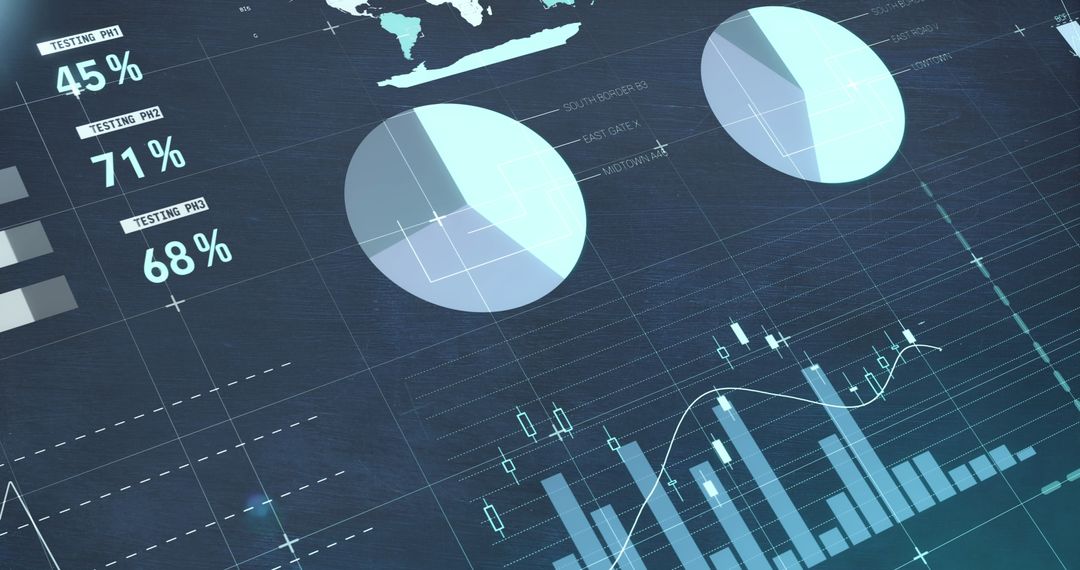
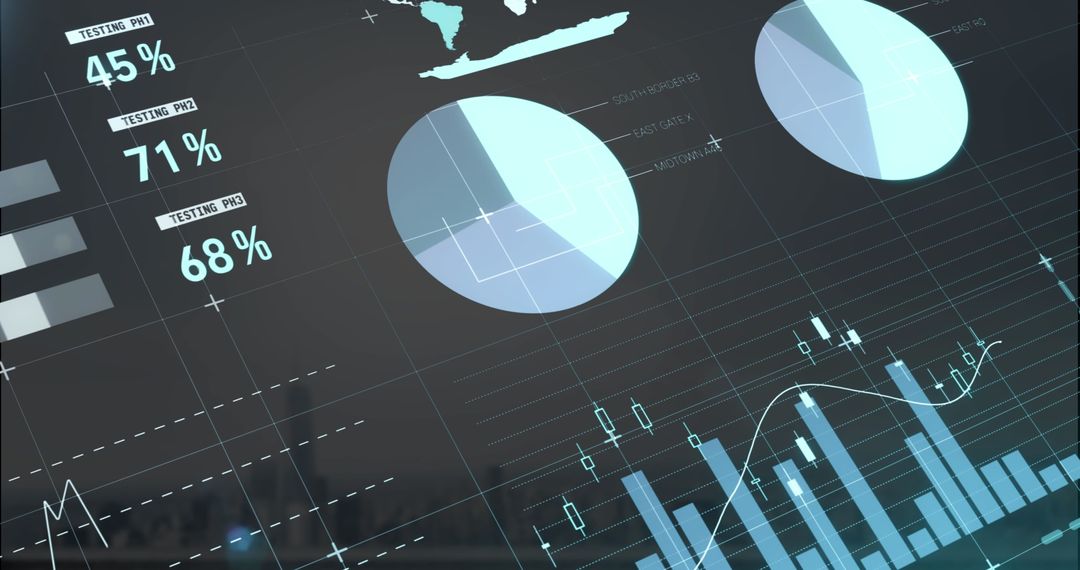
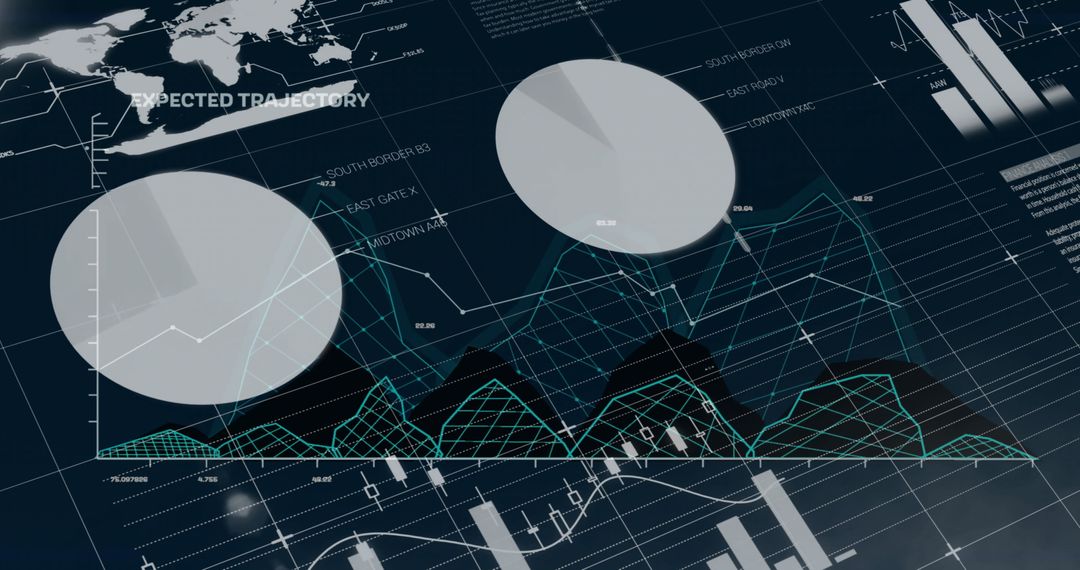
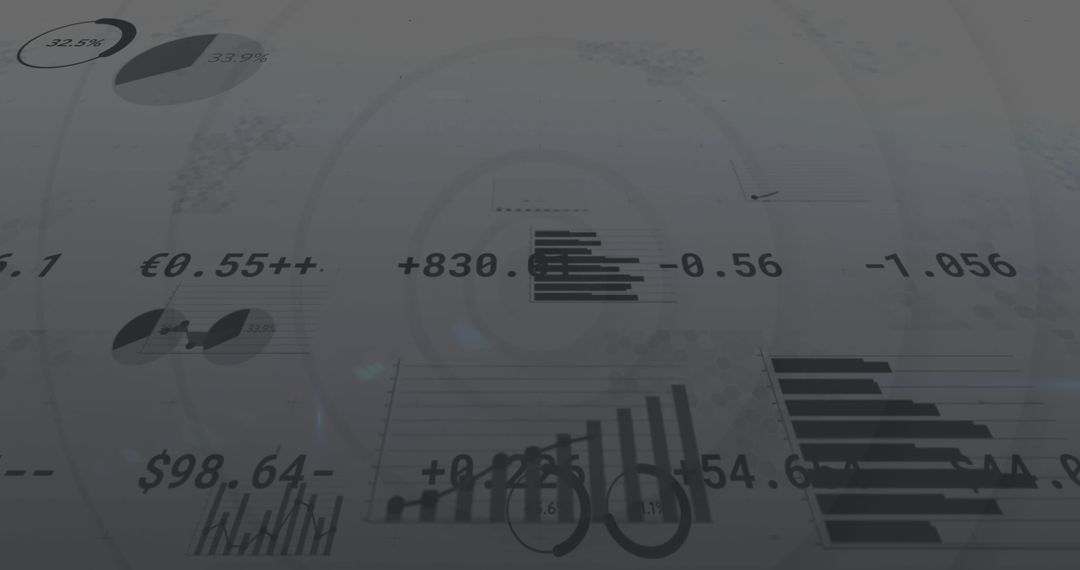
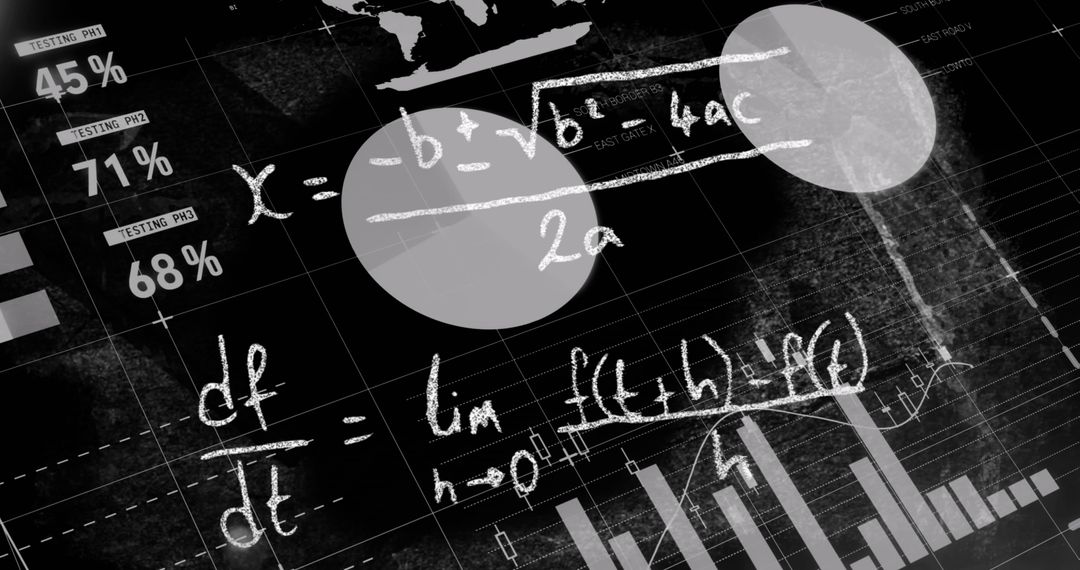
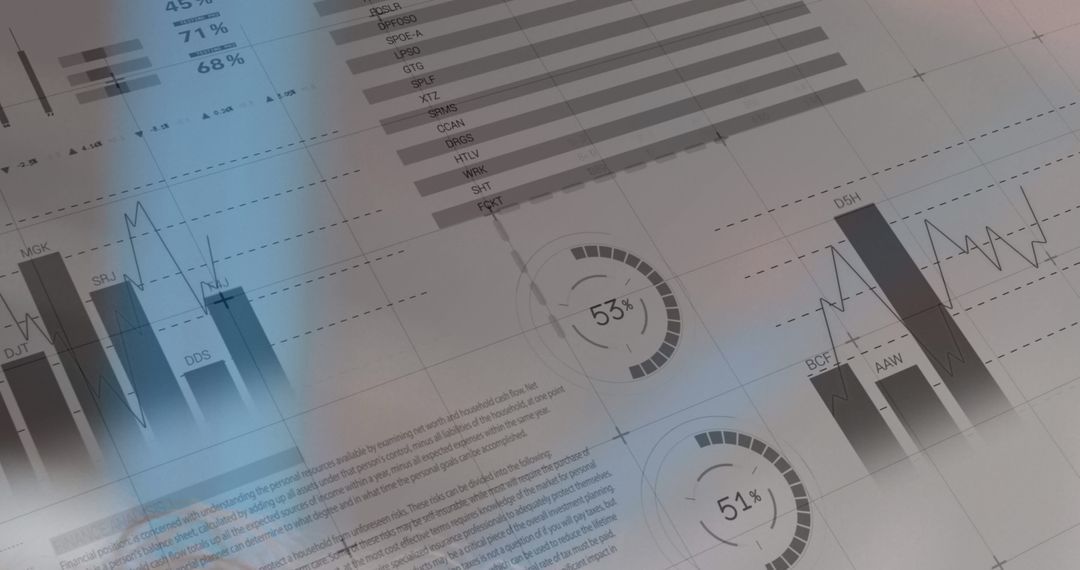
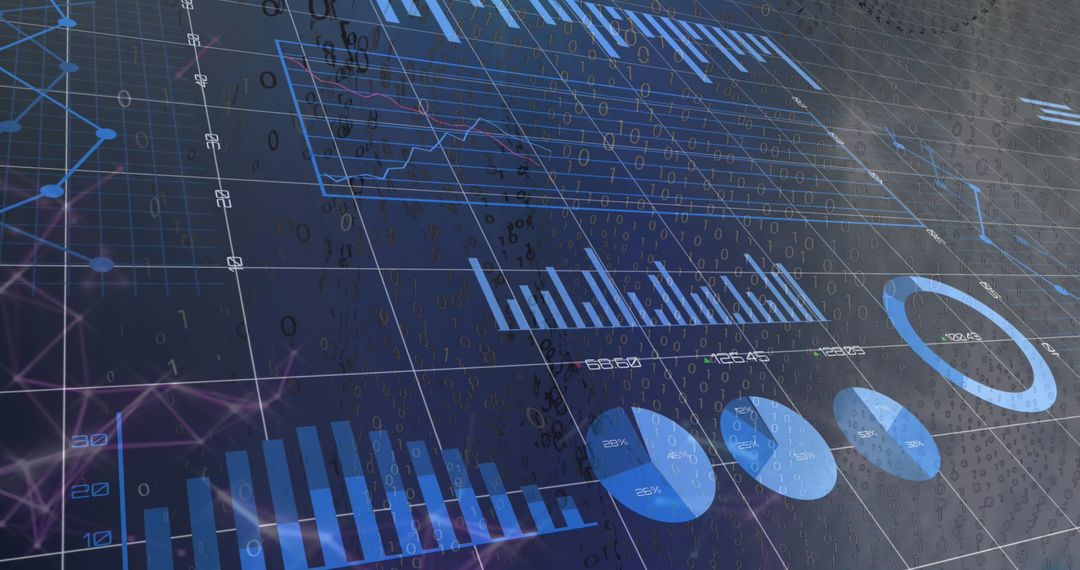
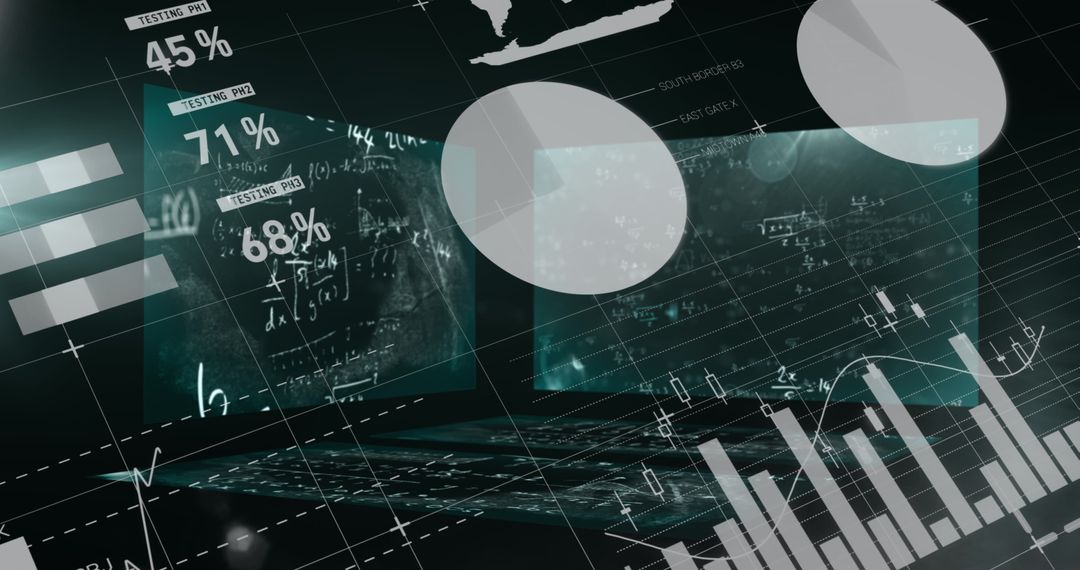
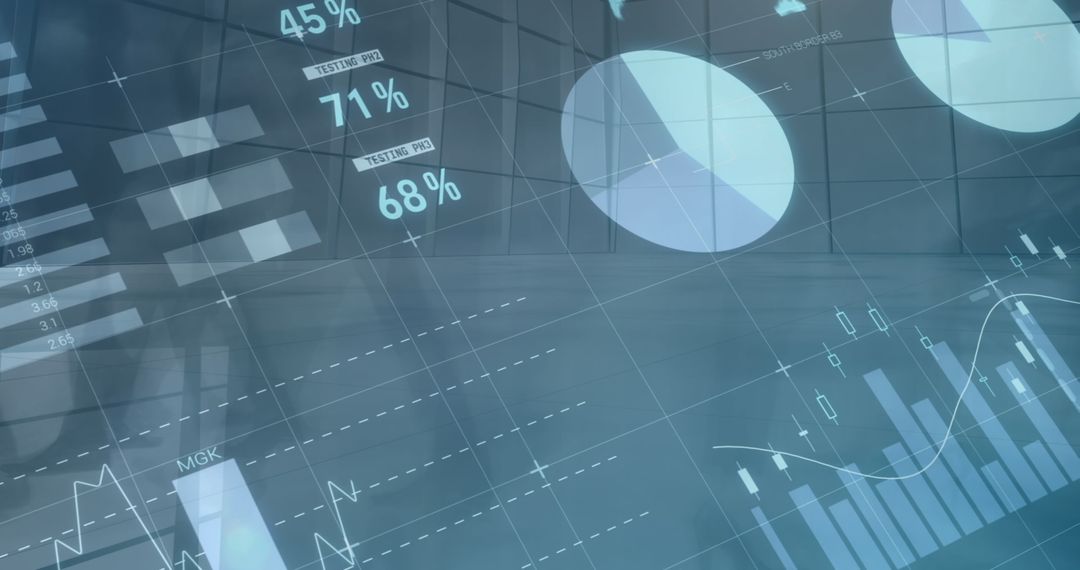
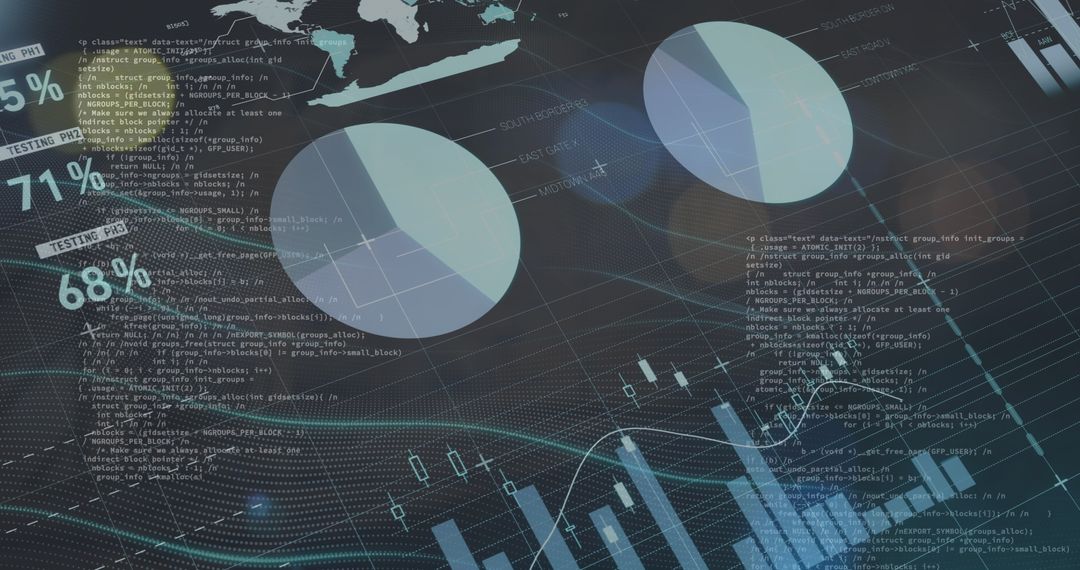
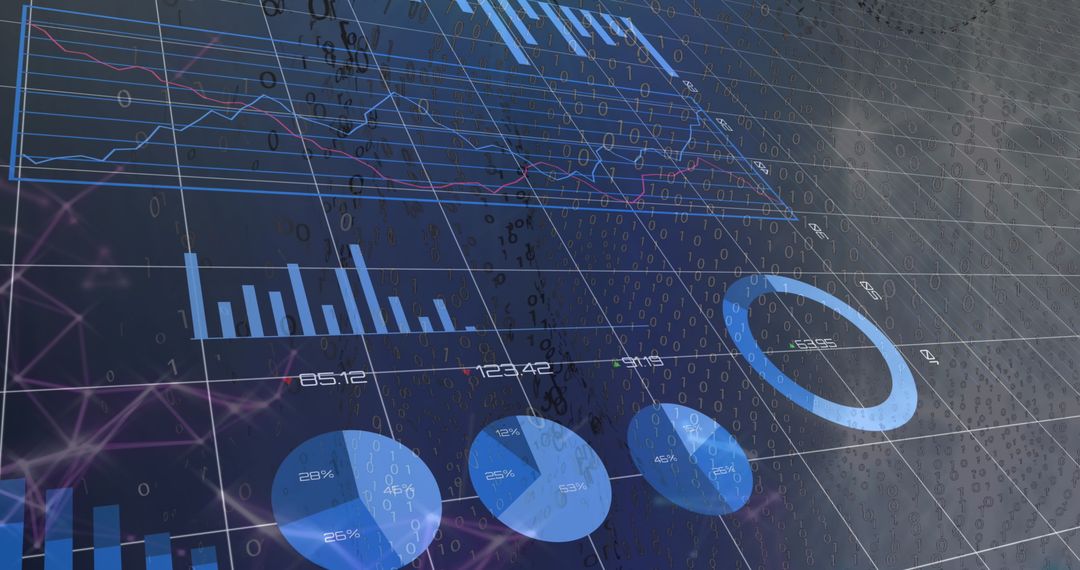
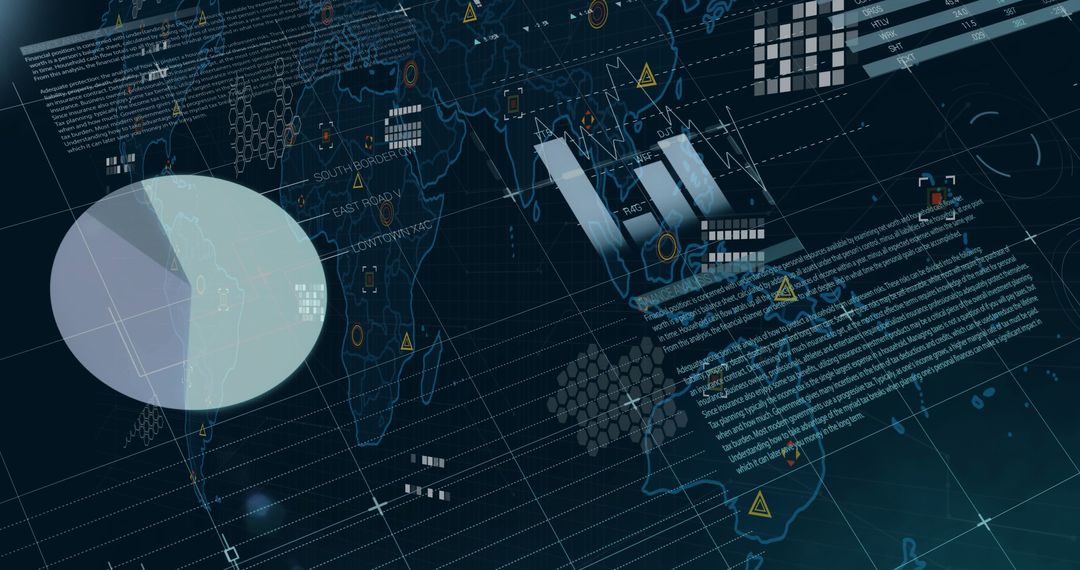
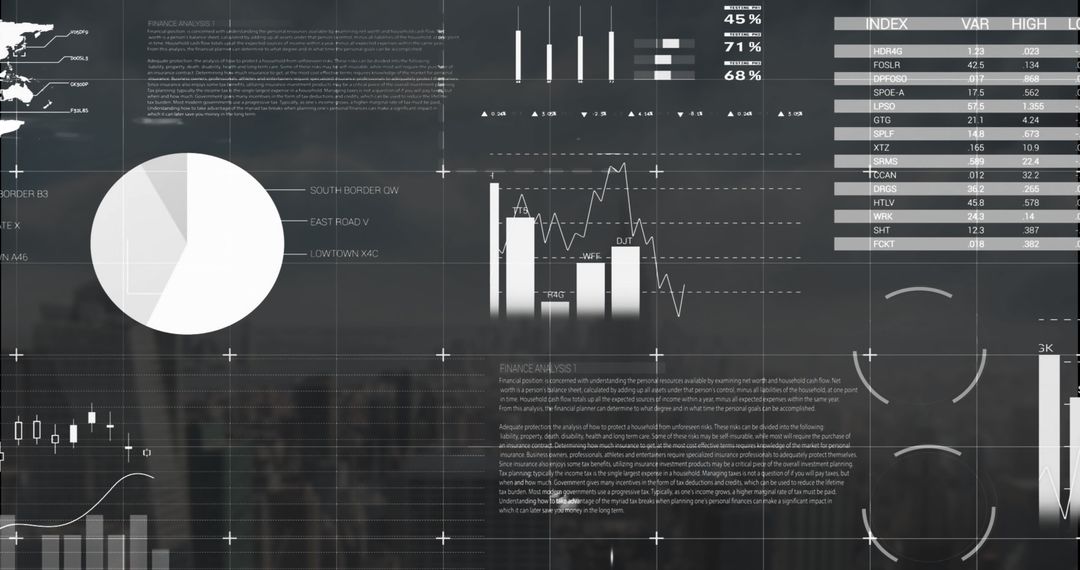
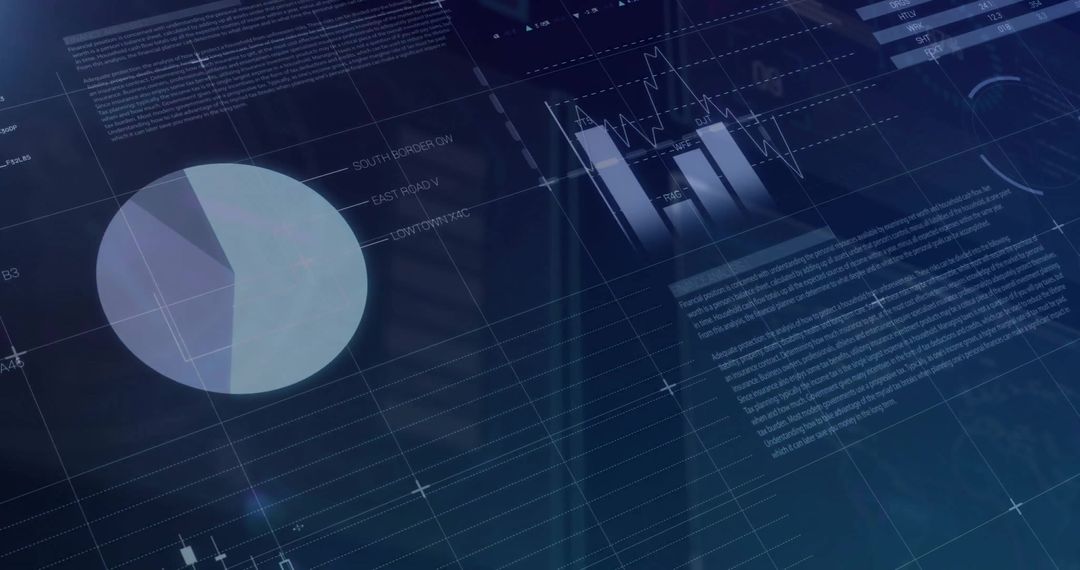
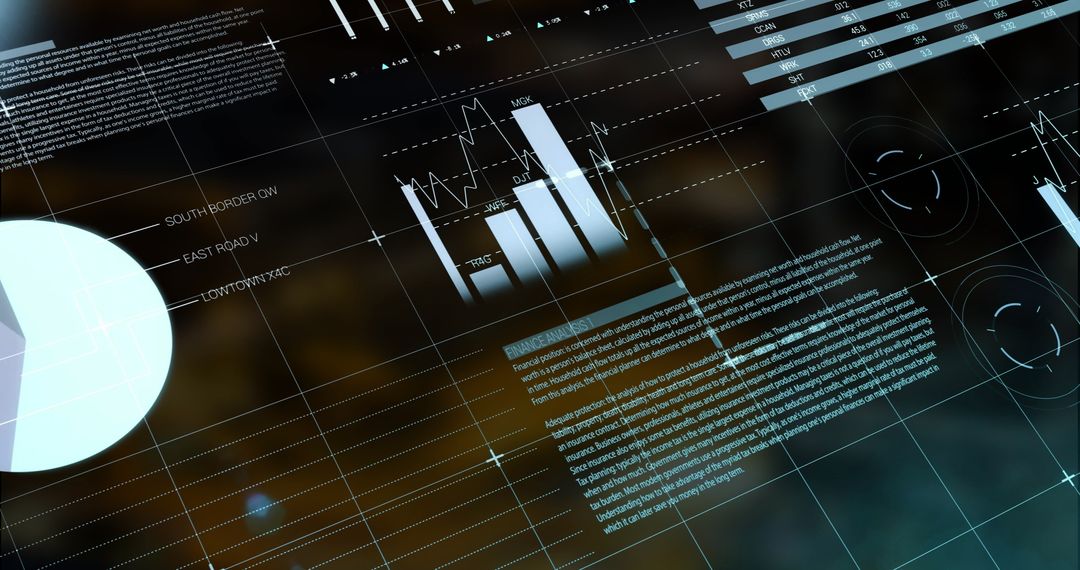
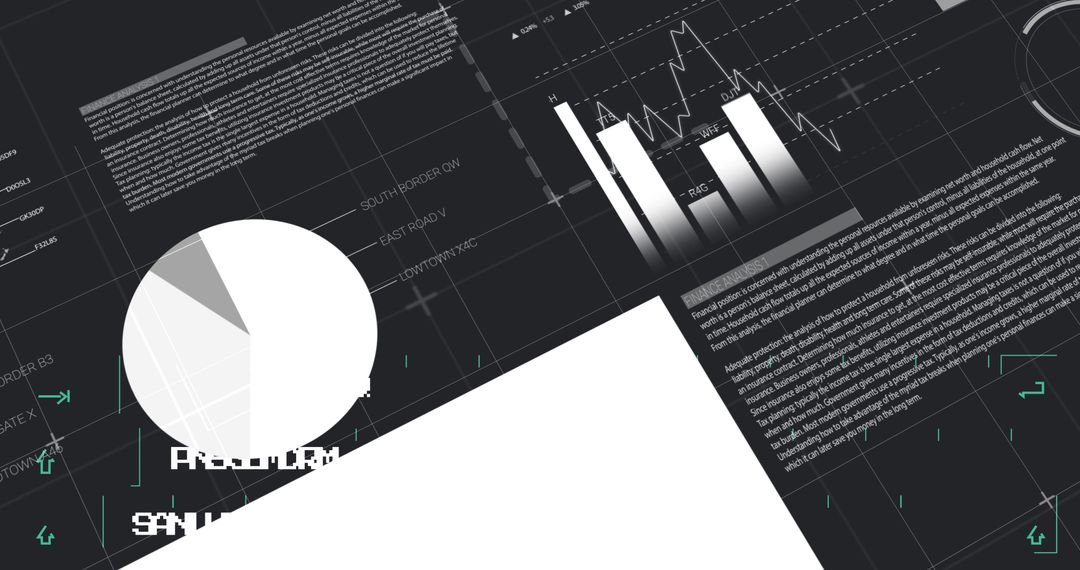
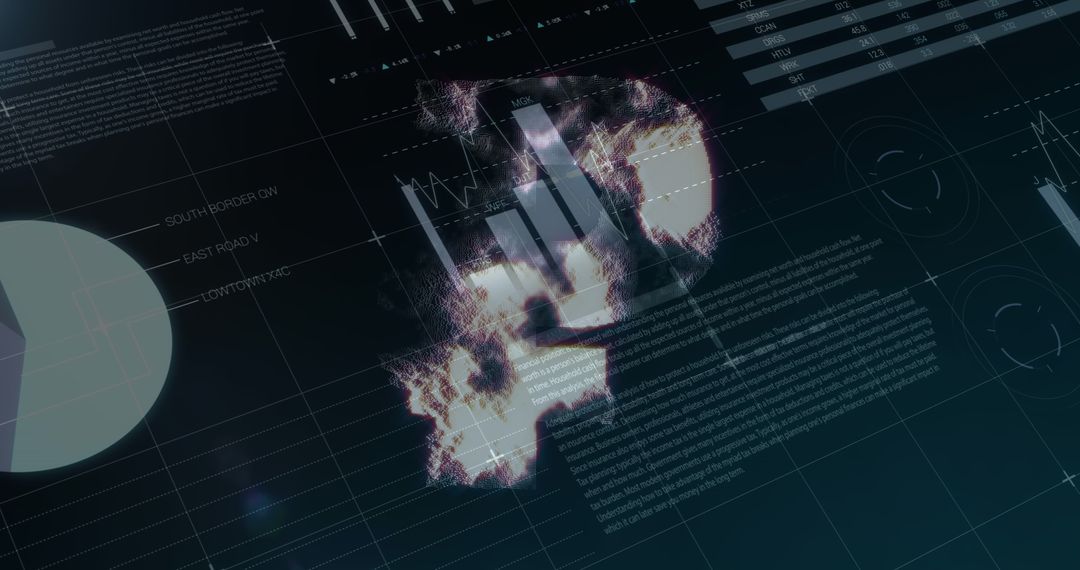
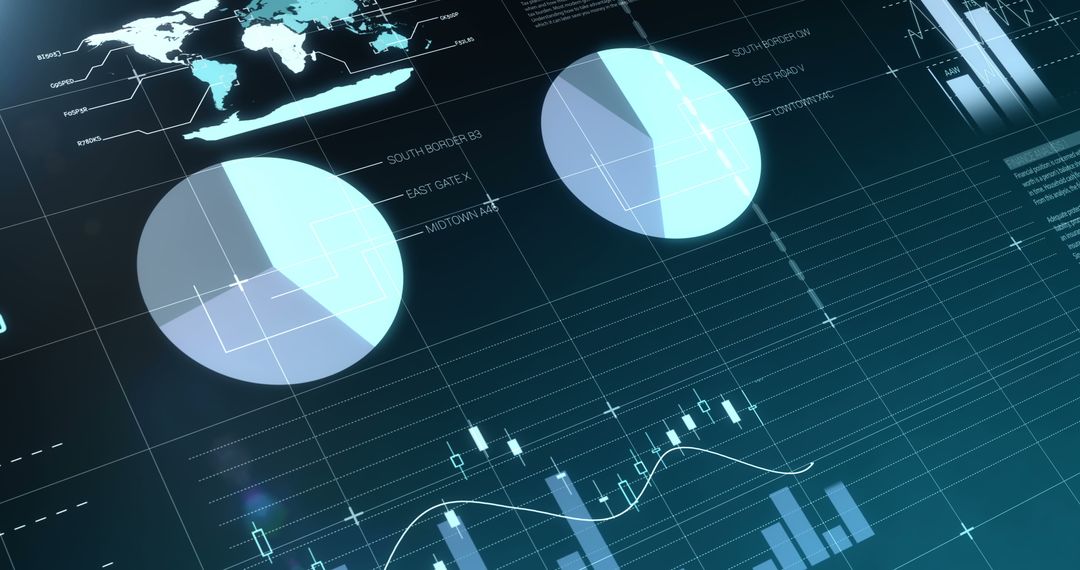
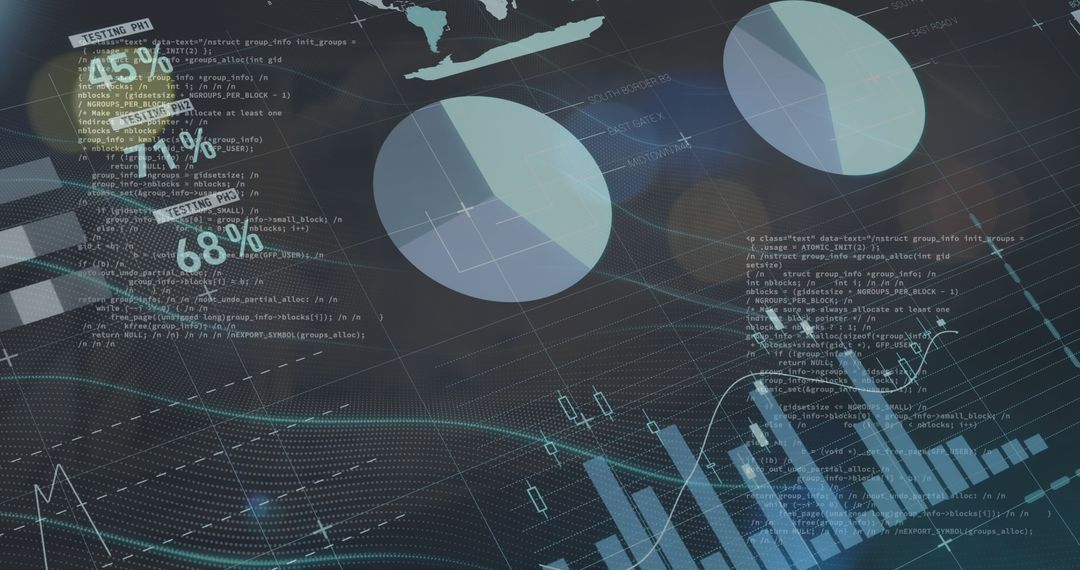
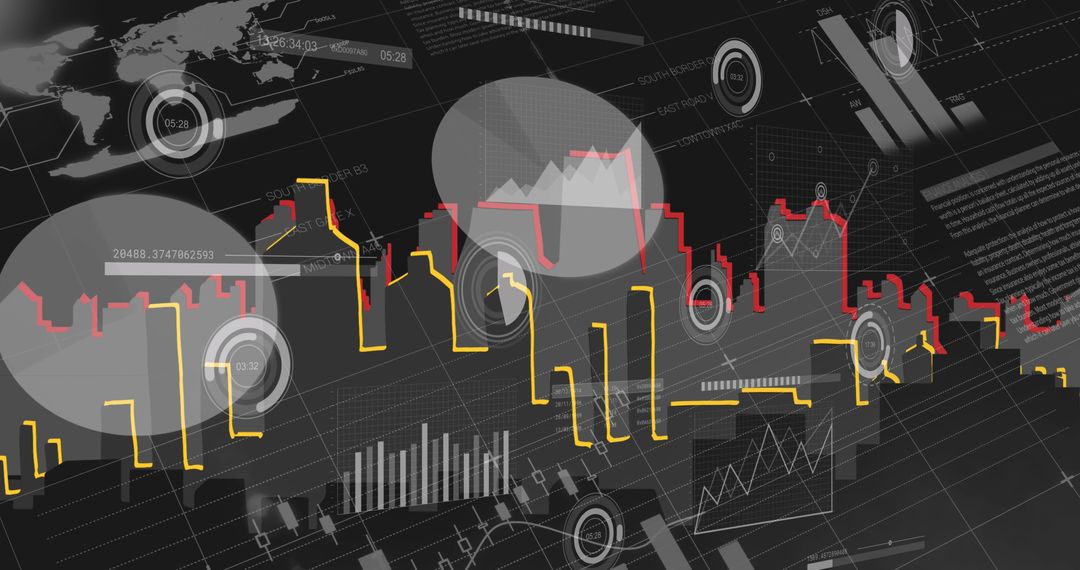
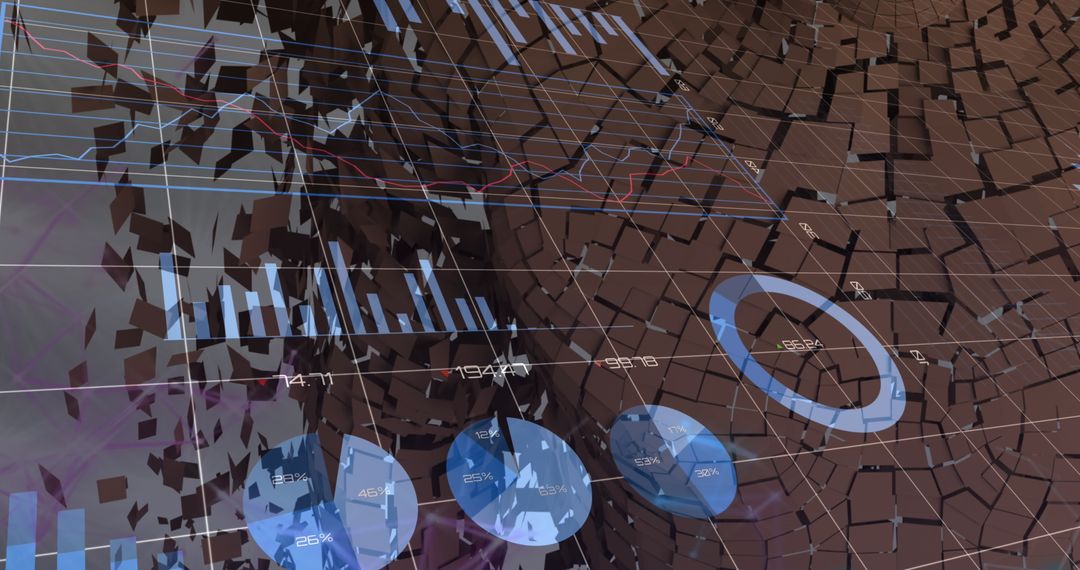
- Fast Walkers and Financial Data merger Symbolizing Modern Business Pace
Fast Walkers and Financial Data merger Symbolizing Modern Business Pace Image
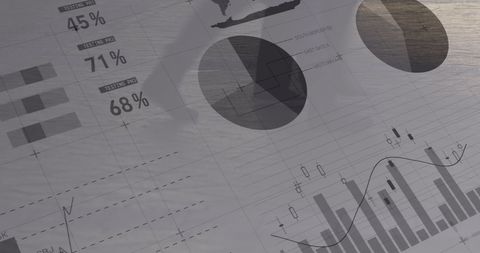
Merging the dynamism of fast walking people with financial analytics and graphs illustrates the fast-paced nature of modern business environments. This combination may be effectively used for publications or product materials focused on finance, investing, or business strategy, emphasizing action, movement, and economic trends.
Powered by  - Get 15% off with code: PIKWIZARD15


2
downloads
downloads
Tags:
Credit Photo
If you would like to credit the Photo, here are some ways you can do so
Text Link
photo Link
<span class="text-link">
<span>
<a target="_blank" href=https://pikwizard.com/photo/fast-walkers-and-financial-data-merger-symbolizing-modern-business-pace/33e17046a718d4bc66bf396ae1d1cd27/>PikWizard</a>
</span>
</span>
<span class="image-link">
<span
style="margin: 0 0 20px 0; display: inline-block; vertical-align: middle; width: 100%;"
>
<a
target="_blank"
href="https://pikwizard.com/photo/fast-walkers-and-financial-data-merger-symbolizing-modern-business-pace/33e17046a718d4bc66bf396ae1d1cd27/"
style="text-decoration: none; font-size: 10px; margin: 0;"
>
<img src="https://pikwizard.com/pw/medium/33e17046a718d4bc66bf396ae1d1cd27.jpg" style="margin: 0; width: 100%;" alt="" />
<p style="font-size: 12px; margin: 0;">PikWizard</p>
</a>
</span>
</span>
Free (free of charge)
Free for personal and commercial use.
Author: People Creations
Similar Free Stock Images
Premium


Premium


Premium


Premium


Premium


Premium

Premium


Premium

Premium


Premium


Premium


Premium


Premium

Premium

Premium

Premium


Premium

Premium

Premium


Premium


Premium


Premium


Premium

Premium