- Home >
- Stock Photos >
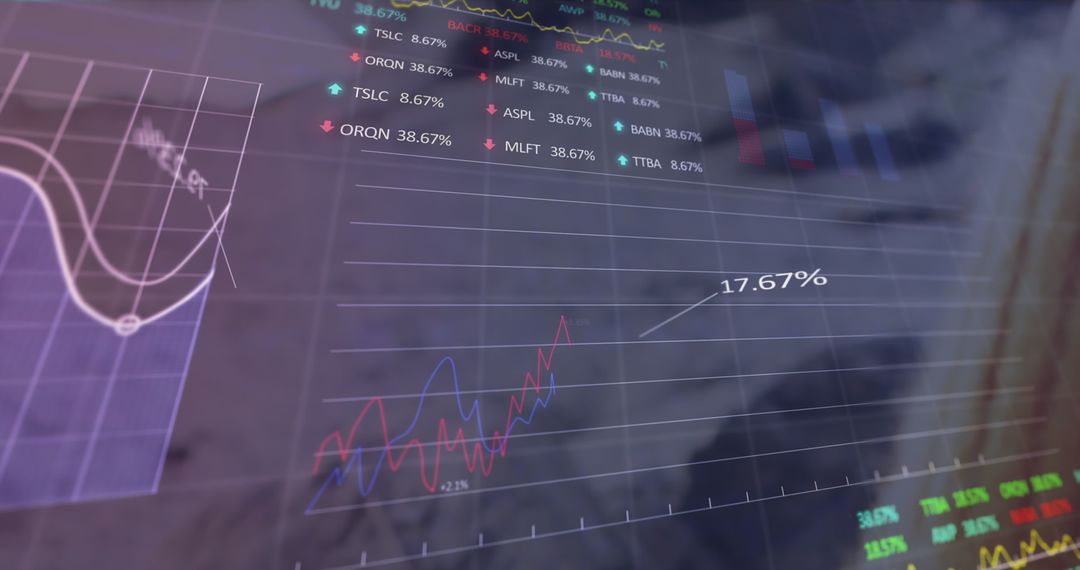
- Finance Charts Overlaid on Calculator and Keyboard Background
Finance Charts Overlaid on Calculator and Keyboard Background Image

This composite image of financial charts, including candlestick graphs, line charts, and pie segments, over a background with a keyboard and calculator symbolizes the integration of technology in finance. Suitable for content on investment strategies, market analysis, economic forecasts, trading platforms, financial data analytics, or promotional material for financial tech apps or services.
Powered by 


0
downloads
downloads
Tags:
More
Credit Photo
If you would like to credit the Photo, here are some ways you can do so
Text Link
photo Link
<span class="text-link">
<span>
<a target="_blank" href=https://pikwizard.com/photo/finance-charts-overlaid-on-calculator-and-keyboard-background/fe4199d3b7067d328a94476999e7f3a7/>PikWizard</a>
</span>
</span>
<span class="image-link">
<span
style="margin: 0 0 20px 0; display: inline-block; vertical-align: middle; width: 100%;"
>
<a
target="_blank"
href="https://pikwizard.com/photo/finance-charts-overlaid-on-calculator-and-keyboard-background/fe4199d3b7067d328a94476999e7f3a7/"
style="text-decoration: none; font-size: 10px; margin: 0;"
>
<img src="https://pikwizard.com/pw/medium/fe4199d3b7067d328a94476999e7f3a7.jpg" style="margin: 0; width: 100%;" alt="" />
<p style="font-size: 12px; margin: 0;">PikWizard</p>
</a>
</span>
</span>
Free (free of charge)
Free for personal and commercial use.
Author: People Creations
Similar Free Stock Images

Premium


Premium


Premium


Premium


Premium


Premium


Premium


Premium


Premium


Premium


Premium


Premium


Premium


Premium


Premium


Premium


Premium


Premium


Premium


Premium


Premium


Premium


Premium


Premium