1. Home > 
  2. Stock Photos > 
  3. Financial Analysis on Tablet with Stock Market Graphs

Financial Analysis on Tablet with Stock Market Graphs Image

Financial Analysis on Tablet with Stock Market Graphs

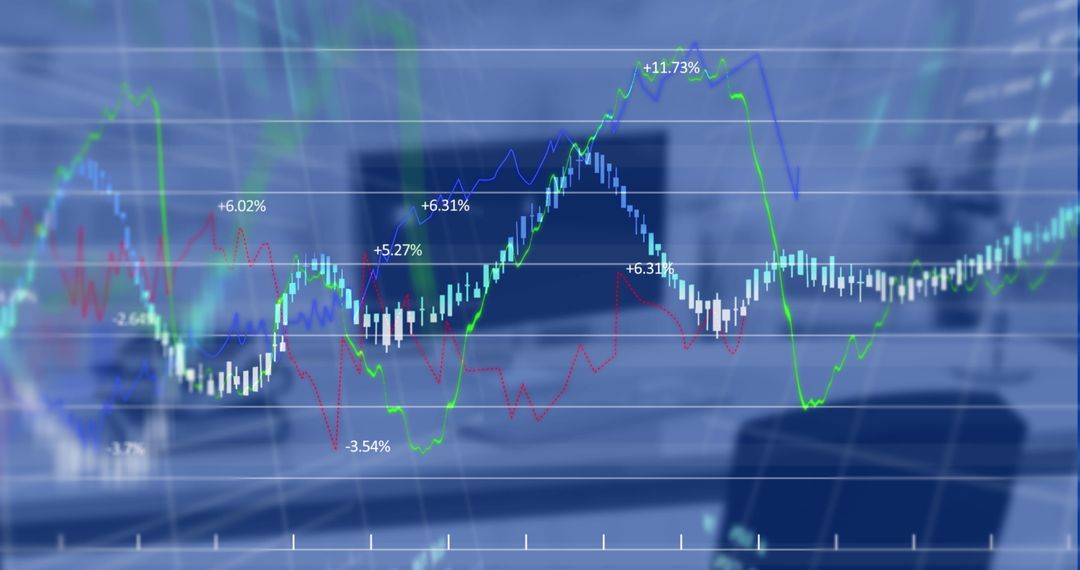
Digital interface featuring stock market graphs displayed on a tablet illustrates real-time growth and trends, ideal for depicting concepts in investment and financial markets. Suitable for financial blog posts, educational materials on trading, and articles about digital economy advancement.

Powered by Shutterstock logo - Get 15% off with code: PIKWIZARD15
businessman hand working with new modern computer and business strategy as concept - Powered by Shutterstock - Get 15% off with code: PIKWIZARD15Analysis finance grow graph and market  investment. Financial  business plan,earnings,sale and strategy. Stock market chart, exchange financial growth diagram. - Powered by Shutterstock - Get 15% off with code: PIKWIZARD15Financial advisor explaining invest stock market data consulting investor. Two busy business men analysts doing finance trading analysis pointing at exchange chart on laptop screen working in office. - Powered by Shutterstock - Get 15% off with code: PIKWIZARD15Online trading, Investment, Strategy market plan, and Stock mark - Powered by Shutterstock - Get 15% off with code: PIKWIZARD15Two diverse crypto traders brokers stock exchange market investors discussing trading charts research reports growth using pc computer looking at screen analyzing invest strategy, financial risks. - Powered by Shutterstock - Get 15% off with code: PIKWIZARD15

Credit Photo

If you would like to credit the Photo, here are some ways you can do so

Free (free of charge)

Free for personal and commercial use.

Author: Creative Art

Similar Free Stock Images

Financial Data Processing with Mathematical Formulae Interface
Premium
Stock market financial investment and trading graph interface showing ticker price evolution with candlestick chart and moving average curves. Increasing profit. Forex. Person touching virtual screen.
Digital Finance Security Amid Analytics Display
Abstract Stock Market Data with Graphs and Numbers
Dynamic Financial Market Trends with Data Visualizations
Financial Graphs with Cityscape Background Reflecting Market Trends
Premium
Double exposure of abstract financial graph with world map on office buildings background, forex and investment concept
Digital Financial Data Trends and Analytics Conceptual Background
Dynamic Data Visualization with Businesspeople Walk
Financial Analysis Overlay on Smartphone Use
Financial Analysis with Diverse Business Team and Market Data
Premium
Business graphs and charts on table. Financial development, Banking Account, Statistics
Holographic Battery Icon Over Stock Market Trading Board
Dynamic Business Analysis with Global Digital Interface Figures
Dynamic Financial Data Charts with Growth Metrics
Dynamic Digital Market Analysis with Holographic Data
Premium
Investors analyze graph data stock market index via digital tablet screen to trade the stock chart for planning investments take profit, trade stock exchange market and cryptocurrency data, financial.
Digital Financial Chart Showing Growth and Dynamic Indicators
Dynamic Stock Market Analysis with Blue Graphs and Percentages
Dynamic Financial Growth Chart with Office Background
Global Networking and Data Visualization Over Stormy Sky
Premium
Stock market analysis, business, finance and investment. Finance analyst analyzing stock market trading graph, economic growth chart, planning and strategy, business investment with financial report
Futuristic Data Analysis Overlaying Cityscape Digital Interface
Business Team Analyzing Real-time Financial Data on Laptop
Digital Financial Data Analytics on Modern Display
Dynamic Stock Market Data Analysis With Graphs and Percentages
Premium
chart trading - stock exchange - economy
Dynamic Financial Data Analytics and Stock Market Trends
Businesswomen Strategizing Amid Declining Stock Market Trends
Global Stock Market Data Overlayed on World Map
Digital Financial Data Visualization on Dark Screen
Dynamic Stock Market Trends with Graphs on Digital Display
Dynamic Stock Market Graphs with Finance Data
Premium
Stock market and business activity in Asia. Corporate value and stock movement. Stock market prices charts on tall buildings background.
Financial Data Analysis with Growth Trend Arrows on Digital Interface
Dynamic Stock Market and Financial Data Analysis Concept
Financial Data Charts in Shimmering Blue Digital Space
Financial Data Analysis on Digital Display
Premium
Stock market graph trading analysis investment financial In red, stock exchange financial or forex graph stock market graph chart business crisis crash loss and grow up gain and profits win up trend.
Dynamic Financial Graph on Digital Background
Businesswoman Discussing Data Analytics with Graph Overlay
Multiethnic Businesswoman Analyzing Financial Graph at Office Meeting
Financial Data Visualization Overlaying Modern Office Setting
Premium
A vibrant financial chart displays stock market data against a city skyline at dusk, emphasizing dynamic market fluctuations
Overlay of Financial Data on Business People in Office Building
Dynamic Financial Data Chart Display with Graphical Analysis
Abstract Financial Graphs with Rising Trends and Positive Indicators
Dynamic Analysis of Stock Market Trends and Patterns
Premium
investment and finance concept, businessman holding virtual trading graph and blurred coins on hand, stock market, profits and business growth.
Dynamic Financial Data Analyzing with Graph Overlays
Tech-Focused Financial Data Visualization with Rising Graphs
Dynamic Financial Data Analysis with Market Charts
Stock Market Graph and Data Analysis
Premium
Stockmarket online trading chart candlestick on crypto currency platform. Stock exchange financial market price candles graph data pattern analysis concept. Computer screen closeup background
Inflation Analytics: Graphic Representation of Stock Market Trends
Abstract Financial Data Graphics Illustrating Analysis
Dynamic Stock Market Graphs Showing Fluctuating Trends
Financial Data Visualization with Increasing Graph Trend
Premium
Stock market or forex trading graph and candlestick chart suitable for financial investment concept. Economy trends background for
Business Professionals Analyzing Stock Market Data on Laptop
Dynamic Stock Market Graph Showing Investment Trends
Digital Finance Graph with Data Points on Dark Background
Dynamic Stock Market Graphs Indicating Financial Trends
Dynamic Stock Market Ticker and Graph Analysis
Financial Data Visualization on Tablet with Coffee Break
Premium
Inflation and tax concept Rising inflation rates graph. Americans' Inflation Problem and global economy recession. interest rate hike with USD money, business, finance and investment background
Dynamic Stock Market Data Visualization on Digital Screen
Dynamic Financial Data Display Over Global Stock Market
Dynamic Stock Market Graphs and Financial Data Visualization
Abstract Financial Data Analysis and Global Business Concept
Premium
Businessman pointing chart financial goals and economic business planning global.
Businesspeople Analyzing Financial Data on Digital Graph
Dynamic Financial Graph Analyzing Market Trends
Dynamic Stock Market Chart Displaying Fluctuating Trends and Growth Percentages
Security Hologram Over Digital Stock Market Analysis
Premium
Investors use laptops to analyze stock market, investment strategies. and business growth analysis, investing in companies with long-term competitive advantages, against the backdrop of the city.
Digital Financial Data Visualization on Grid Display
Dynamic Financial Graphs Illustrating Market Trends and Data
Abstract Financial Data with Digitally Enhanced Graphs
Global Data Pulse on World Map Interface
Premium
Technical price graph and indicator, red and green candlestick chart on blue theme screen, market volatility, up and down trend. Stock trading, crypto currency background.
Financial Data Overlaid on City Skyline
Graphical Data Analysis on Digital Interface
Dynamic Financial Data Against Urban Skyline
Dynamic Financial Graphs and Data Analysis Interface
Premium
Stock market business finance, world economic growth trend, coin stack in background, investing mutual funds, financial risk management, debt ceiling, Quantitative Easing, effect inflation, interest
Financial Data Information with Graphs and Charts for Stock Market Analysis
Financial Data and Stock Market Trends Overlaying Cityscape
Global Financial Data Displayed with Digital Earth
Global Financial Market Trends on Digital Screen
Premium
Stock exchange market graph analysis background
Financial Data Analysis with Growing Stock Trends
Stock Market Data Graph Over Office Desk With Coffee Cup
Dynamic Digital Stock Market Ticker with Growing Graph Trends
Dynamic Stock Market Graphs and Tickers Displaying Performance
Financial Data Processing in Modern Office Environment
Financial Data Analysis with Vibrant Lines on Blue Background
Premium
Businessman analyzing forex trading graph financial data. Stock Market Investments Funds and Digital Assets. Business finance technology and investment concept. Business finance background.
Dynamic Financial Data Processing Showing Stock Market Interface
Dynamic Stock Market Analytics with Digital Financial Graphs
Financial Trends Overlaid on Office Desks with Data Points
Financial Data Analysis on Office Desk, Stock Market Concepts
Premium
Trading investment charts. investment finance concept.
Financial Data Processing with Global Business Analytics
Digital Financial Data Analysis Overlay in Modern Office
Stock Market Data Analysis with Digital Security Element
Dynamic Financial Data Visualization on Grid
Premium
Stock market chart, exchange financial growth diagram.Analysis finance grow graph and market investment. Financial business plan,earnings,sale and strategy.
Dynamic Forex Trading Graphs with Increasing Numbers
Financial Data Processing Over Digital Cityscape
Global Data Analysis with World Map and Pulse Wave
Financial Data Processing Concept Beyond Digital Interface
Premium
Finance chart showed a significant increase in stock market profits, driven by higher interest rates and steady growth in money investments. finance, growth, increase, interest, money, profit, stock.
Digital Financial Data Analytics Overlay in Modern Office
Complex Financial Graphs Showing Market Changes and Data Analysis
Illuminated Financial Data Chart Display on Dark Backdrop
Dynamic Financial Data Graphed Over Digital Grid
Premium
Businessman using laptop computer analyzing sales data and financial growth graph chart report. Business planning, strategy and development. Financial accounting. market research, data analysis
Abstract Financial Data Over Cityscape Imagery
Financial Graphs and Digital Data on Dark Background
Global Data Projection Showing Stock Market Trends with Digital Globe
Glowing Stock Market Financial Chart Data Overlay
Premium
Investors analyze the data stock market index via smartphone screen to trade the stock chart for planning investments take profit, trade stock exchange market and cryptocurrency data, financial.
Abstract Data Visualization with Retro Future Digital Interface