
- Home >
- Stock Photos >
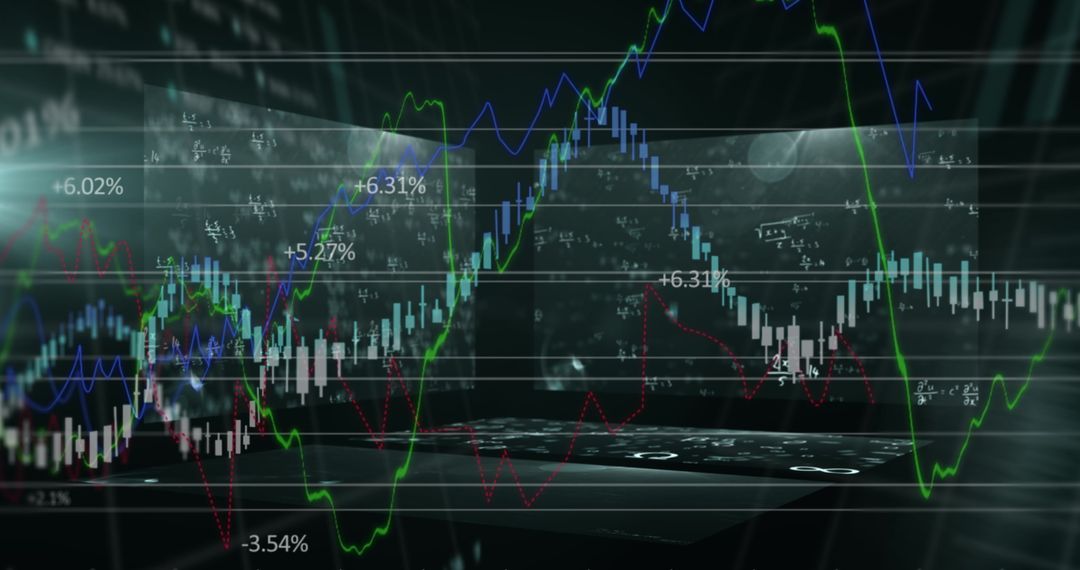
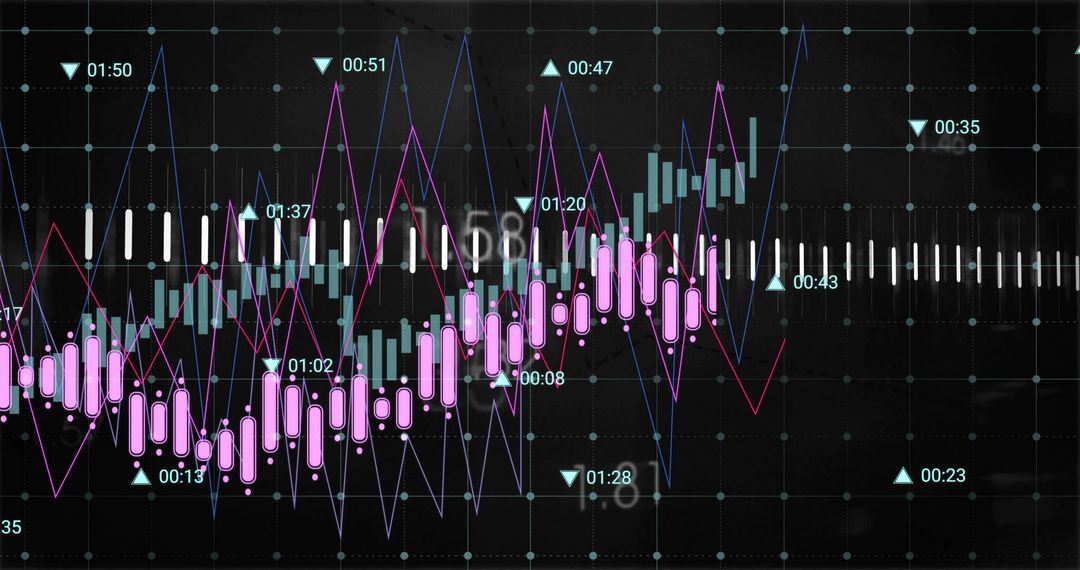
- Financial Analysis with Digital Trading Chart Overlay Trend
Financial Analysis with Digital Trading Chart Overlay Trend Image
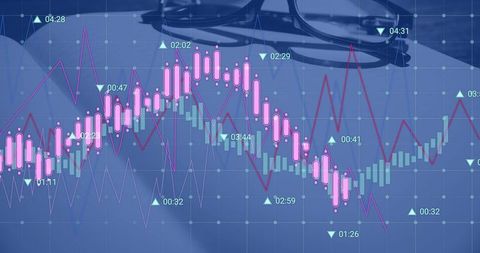
Visual depicting financial and investment analysis through digital chart overlay. Featuring candle chart patterns in pink with teal graphs, symbolizing market trends and economic data. Often used for presentations, tutorials, and blog posts about market forecasts, stock trading tips, and business technology enhancements in a modern workplace. Ideal for use in finance-related content and corporate educational material.
Powered by  - Get 15% off with code: PIKWIZARD15


0
downloads
downloads
Tags:
More
Credit Photo
If you would like to credit the Photo, here are some ways you can do so
Text Link
photo Link
<span class="text-link">
<span>
<a target="_blank" href=https://pikwizard.com/photo/financial-analysis-with-digital-trading-chart-overlay-trend/286c1b08f88012baf2c2932af42afa88/>PikWizard</a>
</span>
</span>
<span class="image-link">
<span
style="margin: 0 0 20px 0; display: inline-block; vertical-align: middle; width: 100%;"
>
<a
target="_blank"
href="https://pikwizard.com/photo/financial-analysis-with-digital-trading-chart-overlay-trend/286c1b08f88012baf2c2932af42afa88/"
style="text-decoration: none; font-size: 10px; margin: 0;"
>
<img src="https://pikwizard.com/pw/medium/286c1b08f88012baf2c2932af42afa88.jpg" style="margin: 0; width: 100%;" alt="" />
<p style="font-size: 12px; margin: 0;">PikWizard</p>
</a>
</span>
</span>
Free (free of charge)
Free for personal and commercial use.
Author: People Creations
Similar Free Stock Images

Premium


Premium


Premium


Premium


Premium


Premium


Premium


Premium


Premium


Premium


Premium


Premium


Premium


Premium


Premium


Premium


Premium


Premium


Premium


Premium


Premium


Premium


Premium


Premium

