- Home >
- Stock Photos >
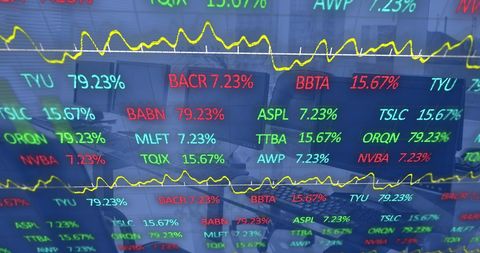
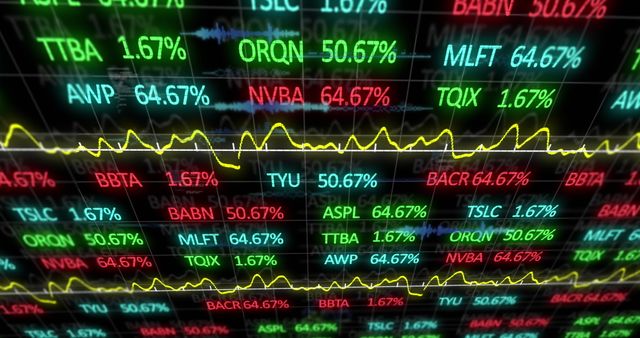
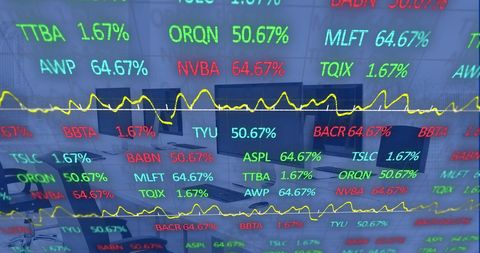
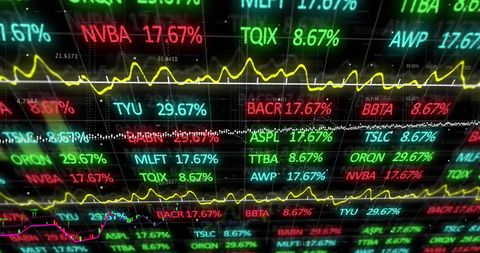
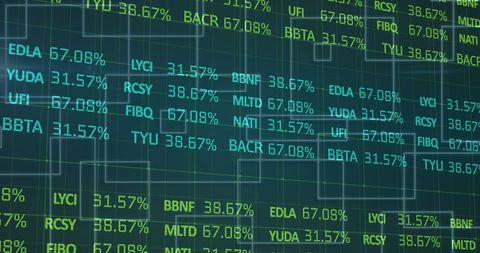
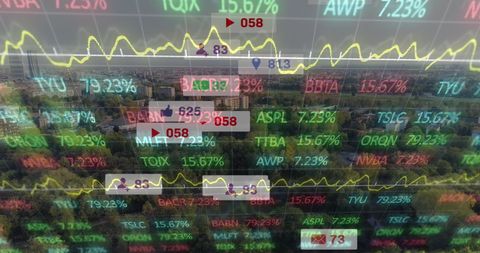
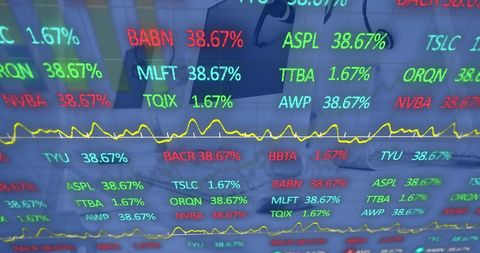
- Financial Analysts in Office Analyzing Stock Market Data Visualization
Financial Analysts in Office Analyzing Stock Market Data Visualization Image

Business professionals are in modern office collaborating over visible stock market data projections on transparent screen, representing teamwork and analysis. Useful for topics on finance, investment strategies, business meetings, corporate teamwork, economic reports, market analysis, and communication solutions within a professional work environment.
Powered by  - Get 15% off with code: PIKWIZARD15


2
downloads
downloads
Tags:
More
Credit Photo
If you would like to credit the Photo, here are some ways you can do so
Text Link
photo Link
<span class="text-link">
<span>
<a target="_blank" href=https://pikwizard.com/photo/financial-analysts-in-office-analyzing-stock-market-data-visualization/2bd43de74211890cf377e8d85ed94d76/>PikWizard</a>
</span>
</span>
<span class="image-link">
<span
style="margin: 0 0 20px 0; display: inline-block; vertical-align: middle; width: 100%;"
>
<a
target="_blank"
href="https://pikwizard.com/photo/financial-analysts-in-office-analyzing-stock-market-data-visualization/2bd43de74211890cf377e8d85ed94d76/"
style="text-decoration: none; font-size: 10px; margin: 0;"
>
<img src="https://pikwizard.com/pw/medium/2bd43de74211890cf377e8d85ed94d76.jpg" style="margin: 0; width: 100%;" alt="" />
<p style="font-size: 12px; margin: 0;">PikWizard</p>
</a>
</span>
</span>
Free (free of charge)
Free for personal and commercial use.
Author: Creative Art
Similar Free Stock Images

Premium


Premium


Premium


Premium


Premium


Premium


Premium


Premium


Premium


Premium


Premium


Premium


Premium


Premium


Premium


Premium


Premium


Premium


Premium


Premium


Premium


Premium


Premium


Premium


Premium