- Home >
- Stock Photos >
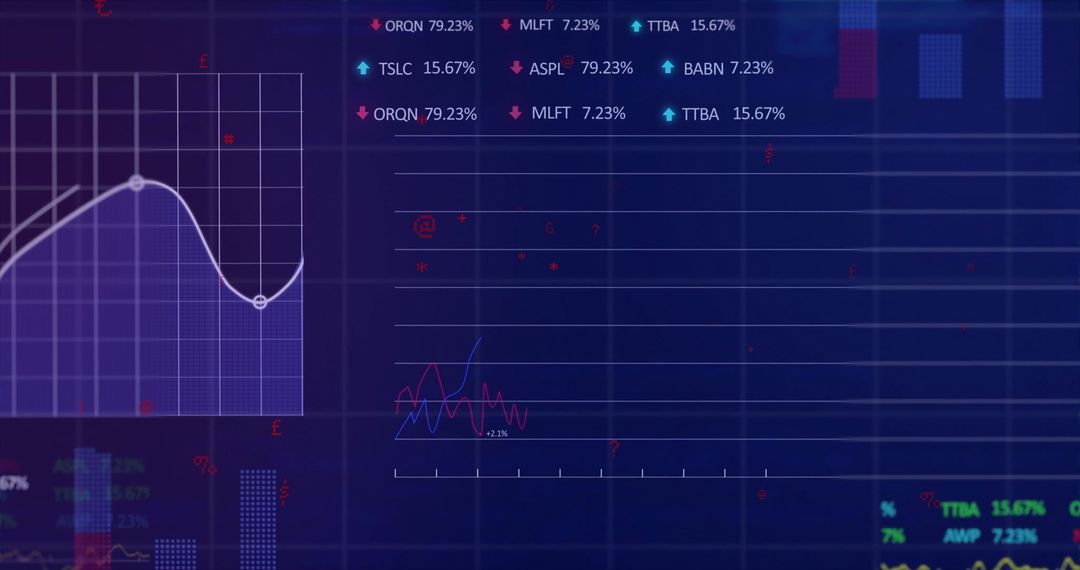
- Financial Analytics Dashboard with Growth Trends and Indicators
Financial Analytics Dashboard with Growth Trends and Indicators Image

Depicts detailed financial analytics with focus on trends and indicators on turquoise bar graphs overlaid with blue and magenta lines. Gridlines and percentage labels enhance interpretation of data, making it ideal for presentations on financial performance, investment strategies, and market analysis. Suitable for use in financial apps, investment tools, and economic reports.
Powered by 


0
downloads
downloads
Tags:
More
Credit Photo
If you would like to credit the Photo, here are some ways you can do so
Text Link
photo Link
<span class="text-link">
<span>
<a target="_blank" href=https://pikwizard.com/photo/financial-analytics-dashboard-with-growth-trends-and-indicators/b6832f0d359d8568591478e27505677c/>PikWizard</a>
</span>
</span>
<span class="image-link">
<span
style="margin: 0 0 20px 0; display: inline-block; vertical-align: middle; width: 100%;"
>
<a
target="_blank"
href="https://pikwizard.com/photo/financial-analytics-dashboard-with-growth-trends-and-indicators/b6832f0d359d8568591478e27505677c/"
style="text-decoration: none; font-size: 10px; margin: 0;"
>
<img src="https://pikwizard.com/pw/medium/b6832f0d359d8568591478e27505677c.jpg" style="margin: 0; width: 100%;" alt="" />
<p style="font-size: 12px; margin: 0;">PikWizard</p>
</a>
</span>
</span>
Free (free of charge)
Free for personal and commercial use.
Author: Authentic Images
Similar Free Stock Images

Premium


Premium


Premium


Premium


Premium


Premium


Premium


Premium


Premium


Premium


Premium


Premium


Premium


Premium


Premium


Premium


Premium


Premium


Premium


Premium


Premium


Premium


Premium


Premium