- Home >
- Stock Photos >
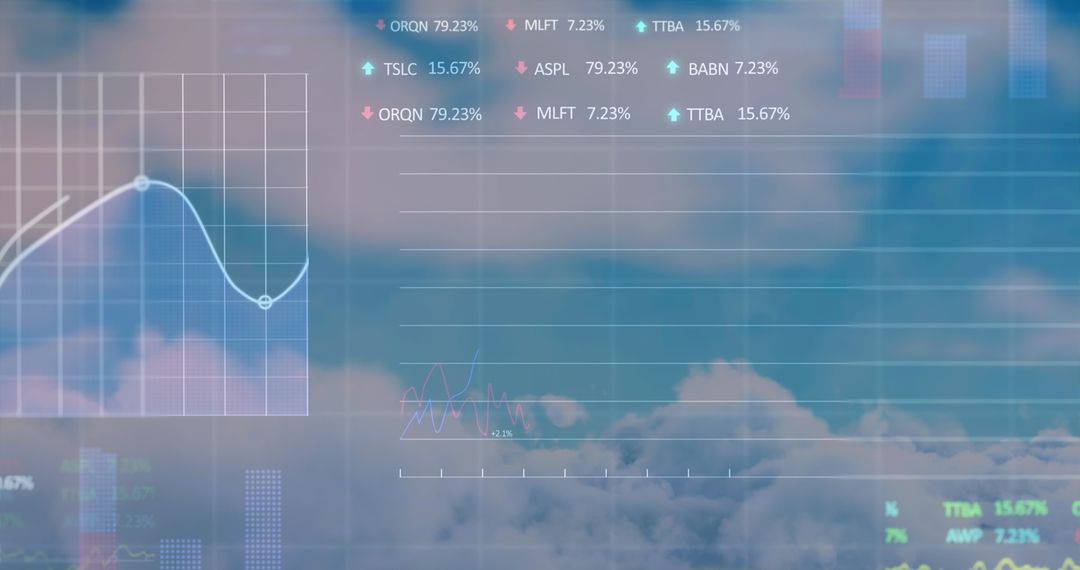
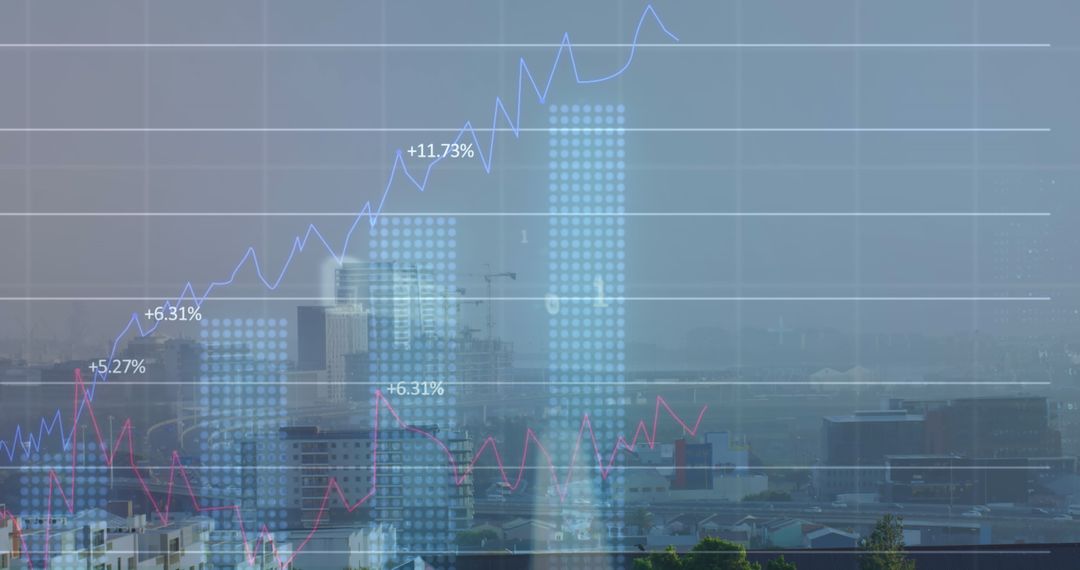
- Financial Chart Overlay on Modern Workspace Desk
Financial Chart Overlay on Modern Workspace Desk Image

Dynamic depiction of financial trends and analysis over a modern desk workspace, showcasing essential elements like spreadsheets and eyeglasses. Perfect for use in articles, blogs, presentations addressing topics of financial growth, data insights, office productivity, and the integration of technology in modern business environments.
Powered by 


2
downloads
downloads
Tags:
More
Credit Photo
If you would like to credit the Photo, here are some ways you can do so
Text Link
photo Link
<span class="text-link">
<span>
<a target="_blank" href=https://pikwizard.com/photo/financial-chart-overlay-on-modern-workspace-desk/f06db4e11747a5d05b6abe37c8da414c/>PikWizard</a>
</span>
</span>
<span class="image-link">
<span
style="margin: 0 0 20px 0; display: inline-block; vertical-align: middle; width: 100%;"
>
<a
target="_blank"
href="https://pikwizard.com/photo/financial-chart-overlay-on-modern-workspace-desk/f06db4e11747a5d05b6abe37c8da414c/"
style="text-decoration: none; font-size: 10px; margin: 0;"
>
<img src="https://pikwizard.com/pw/medium/f06db4e11747a5d05b6abe37c8da414c.jpg" style="margin: 0; width: 100%;" alt="" />
<p style="font-size: 12px; margin: 0;">PikWizard</p>
</a>
</span>
</span>
Free (free of charge)
Free for personal and commercial use.
Author: Awesome Content
Similar Free Stock Images

Premium


Premium


Premium


Premium


Premium


Premium


Premium


Premium


Premium


Premium


Premium


Premium


Premium


Premium


Premium


Premium


Premium


Premium


Premium


Premium


Premium


Premium


Premium


Premium