- Home >
- Stock Photos >
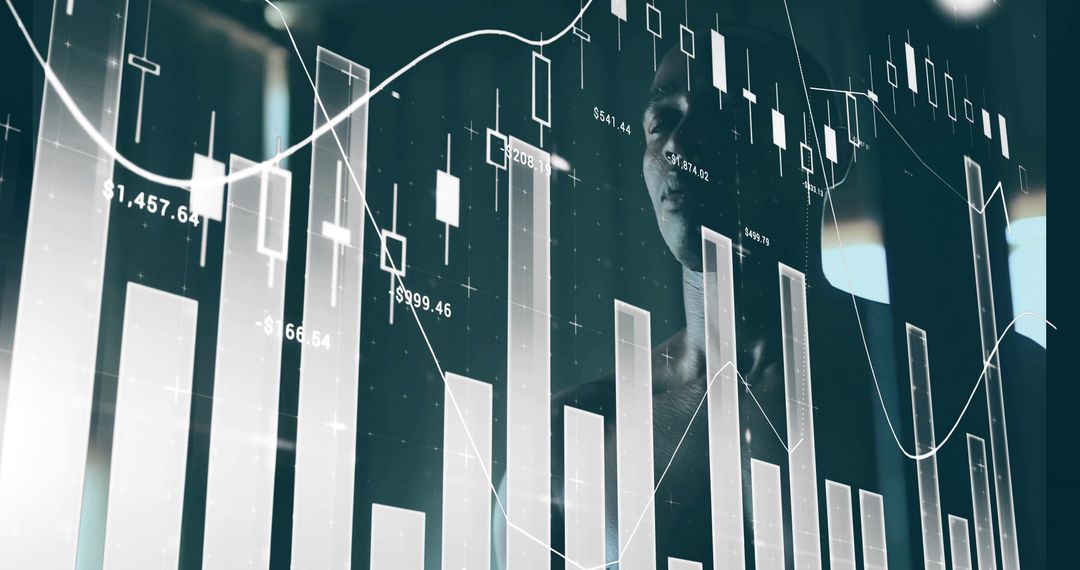
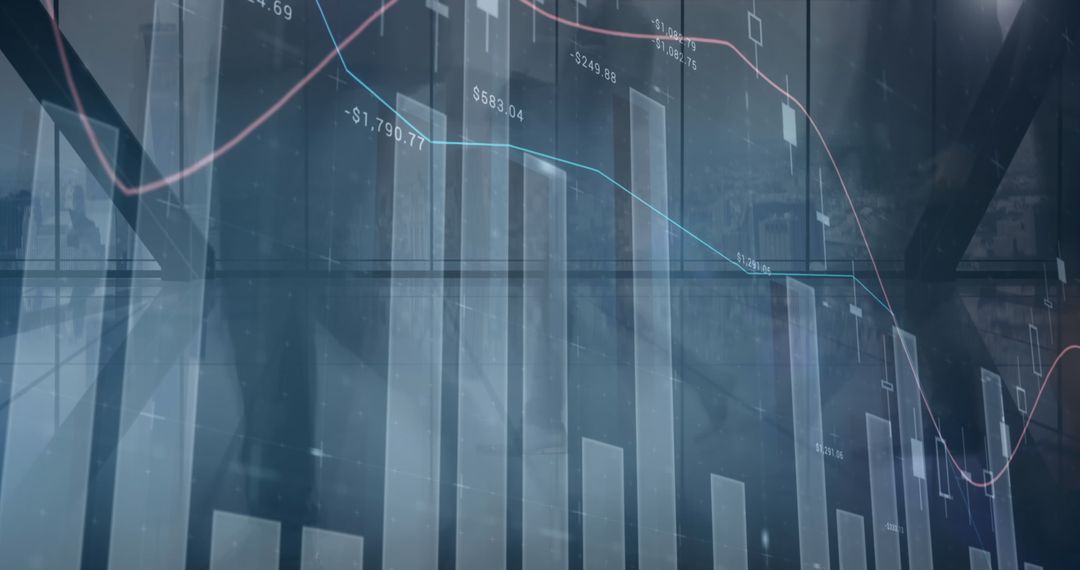
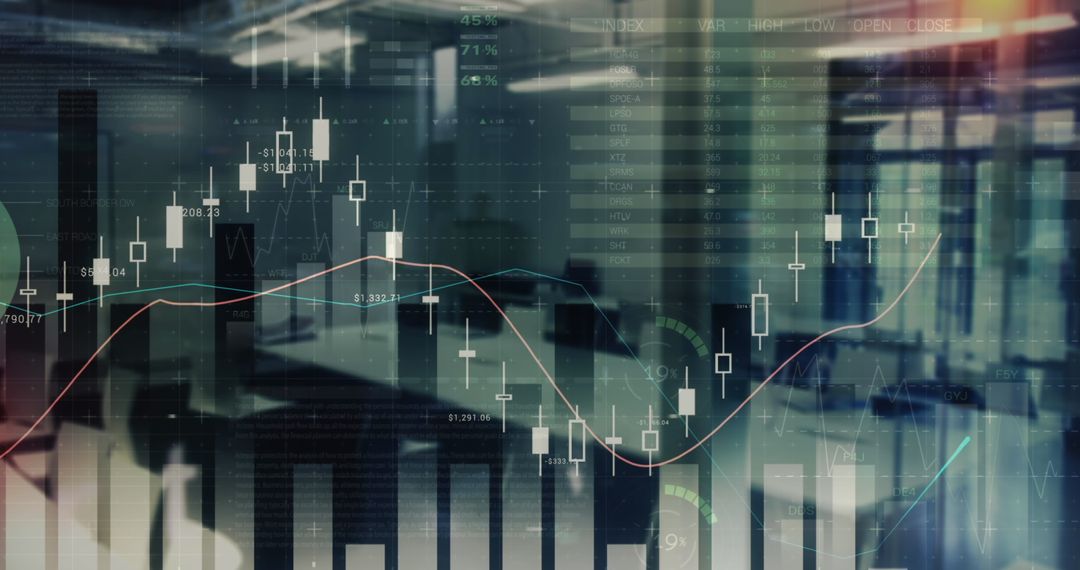
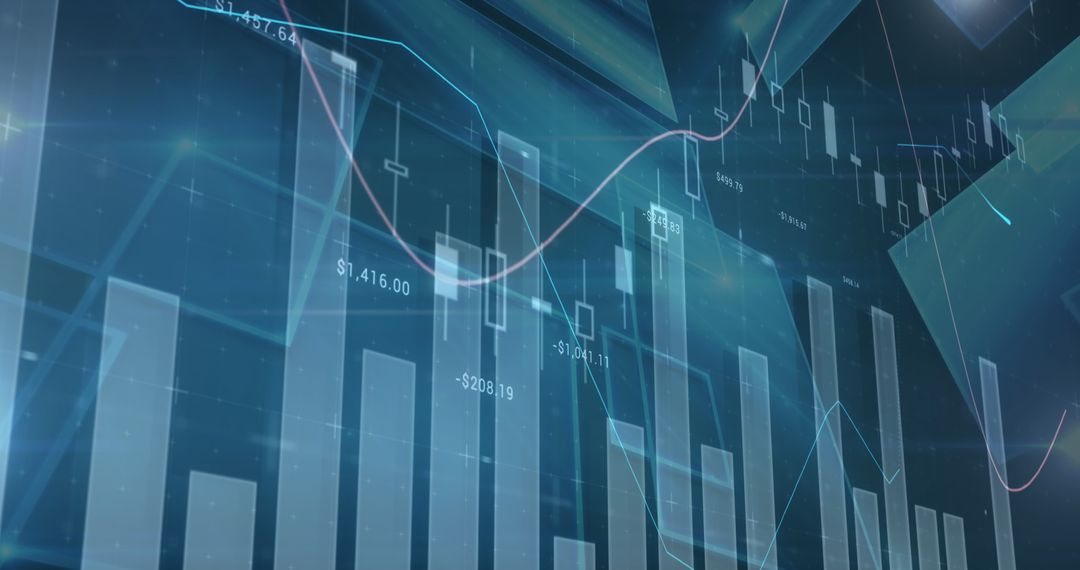
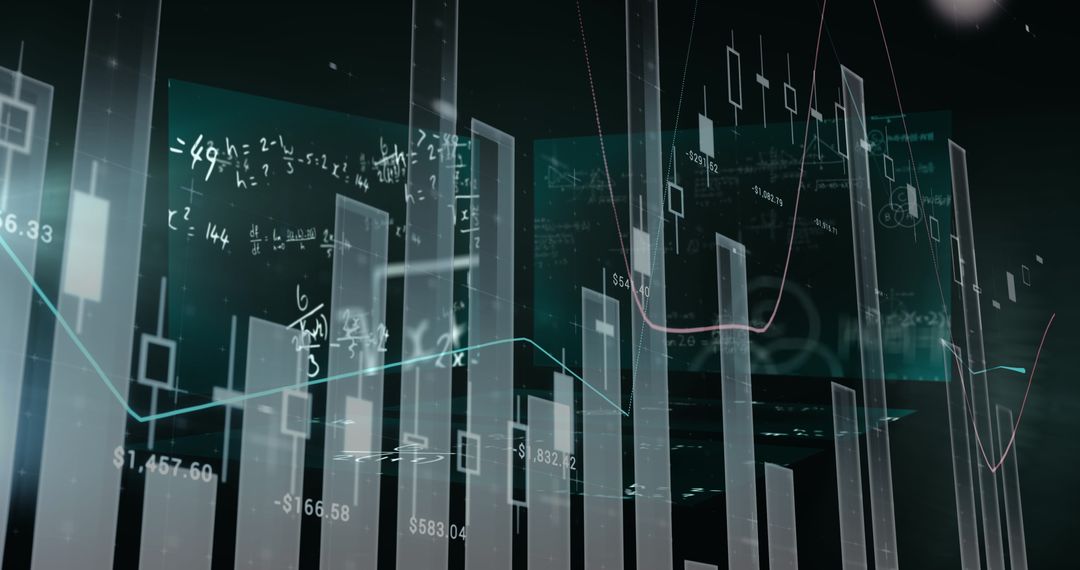
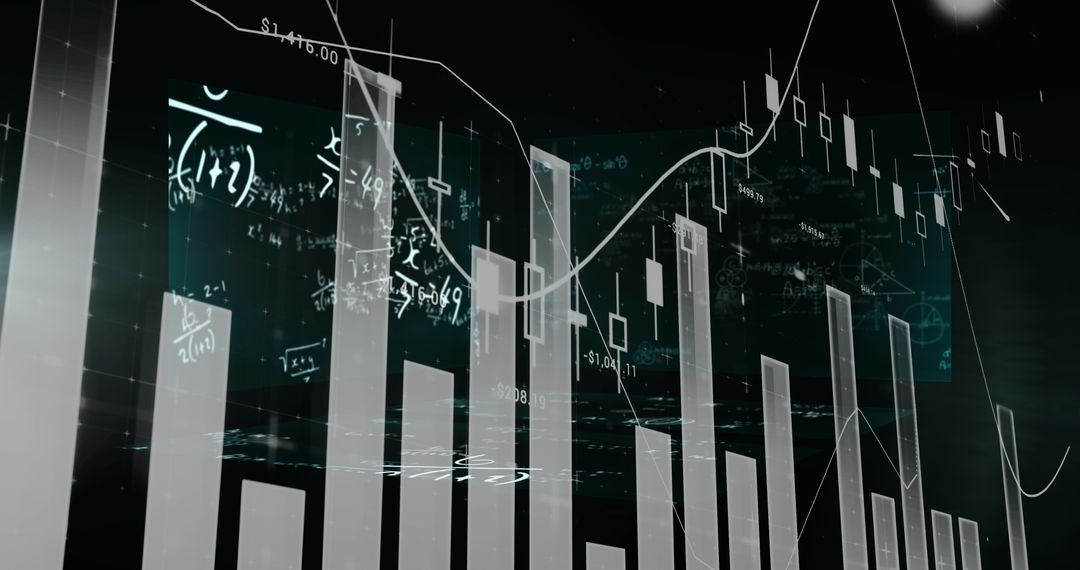
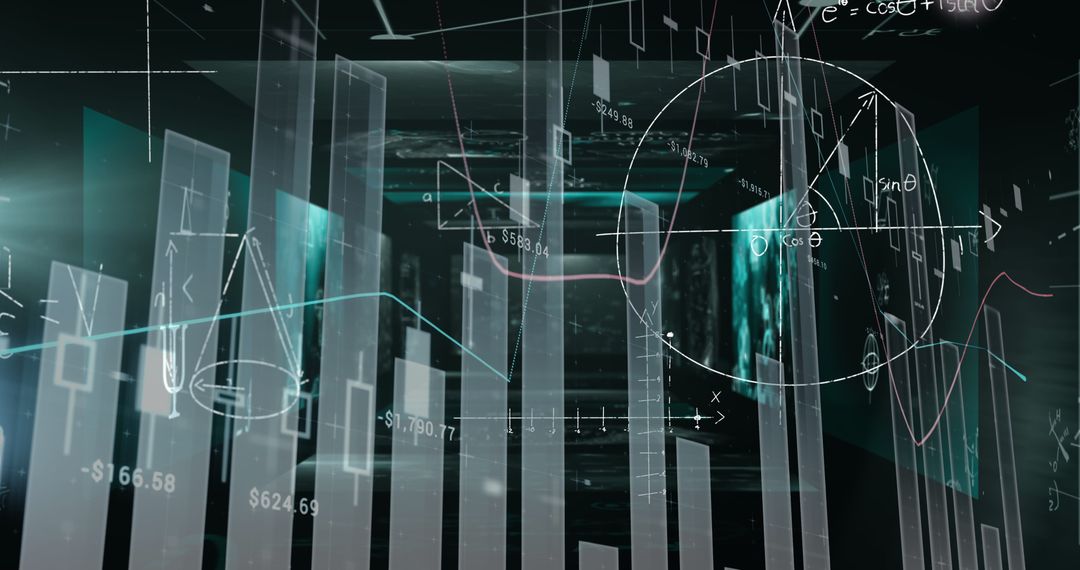
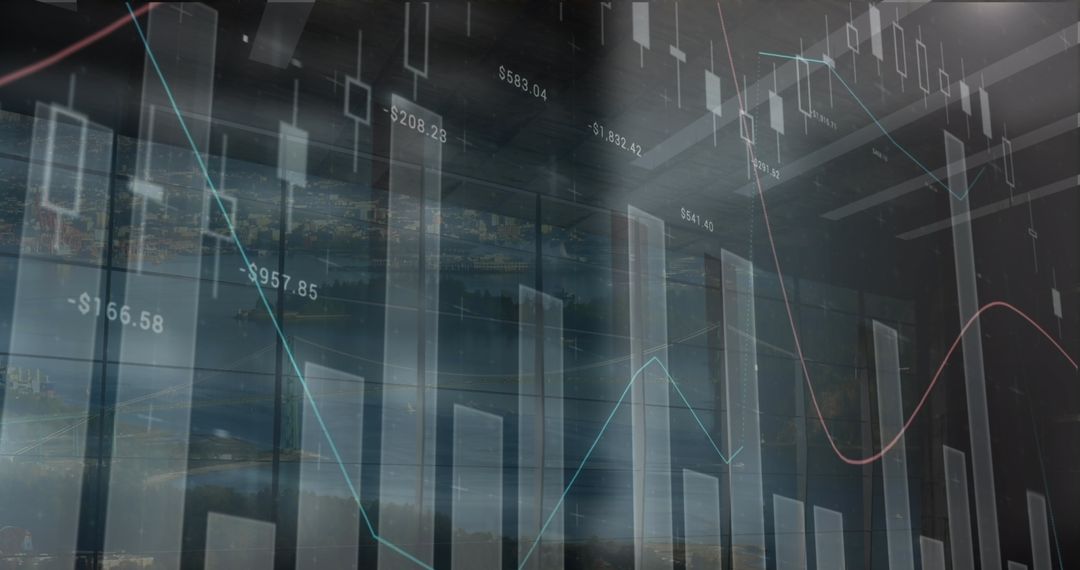
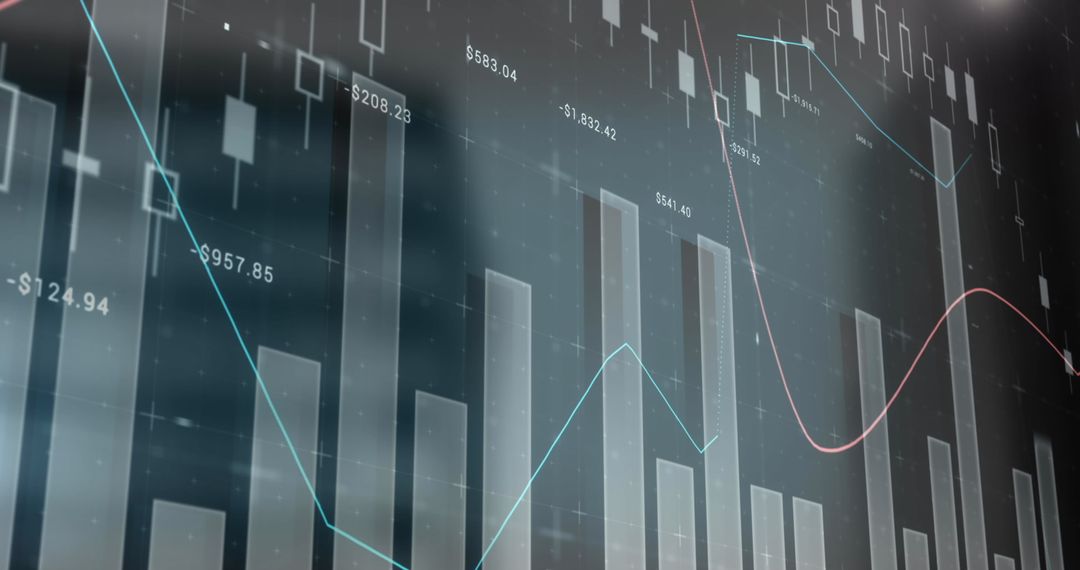
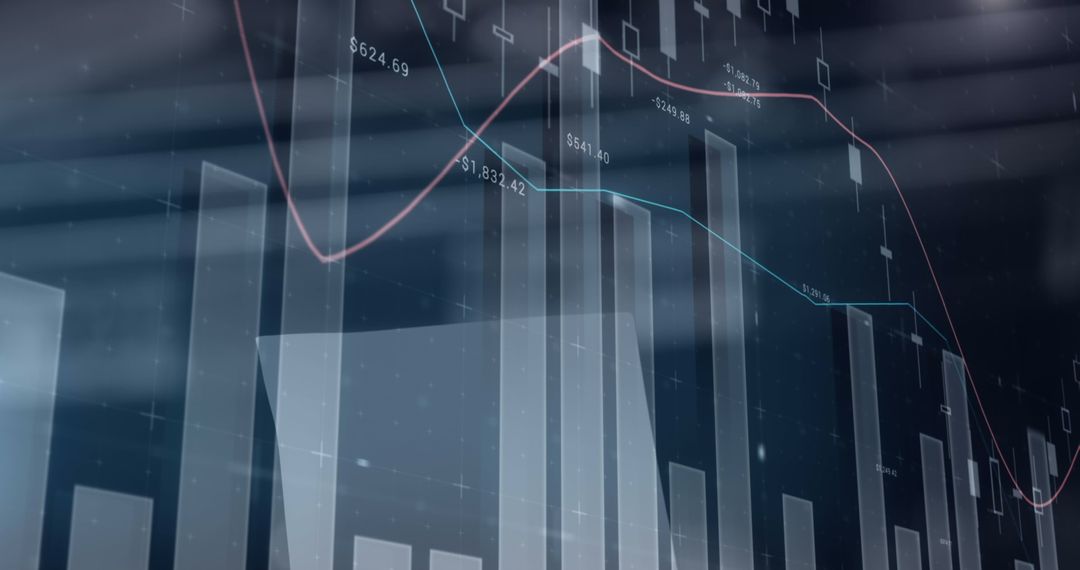
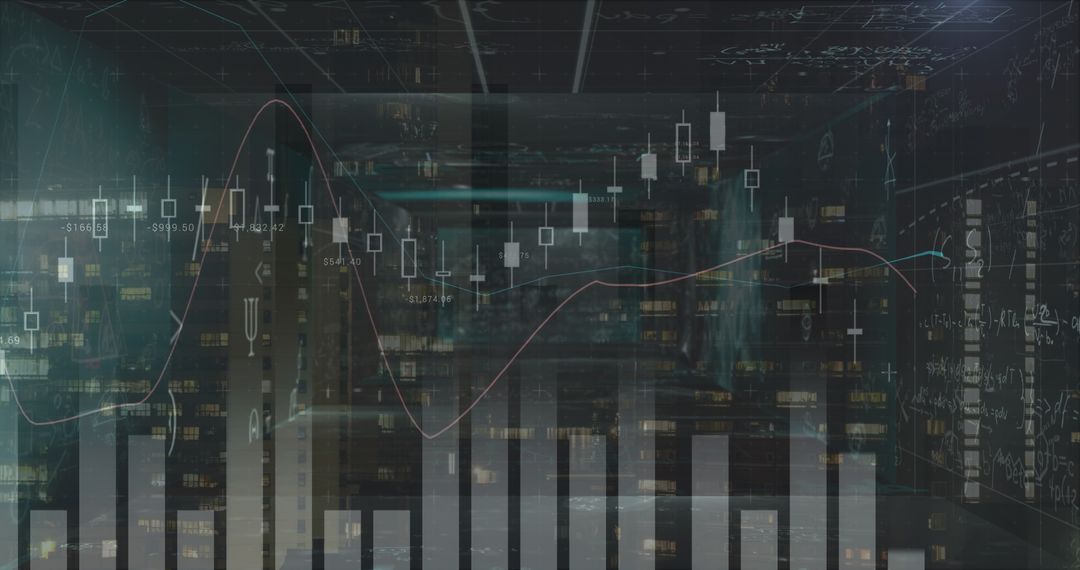
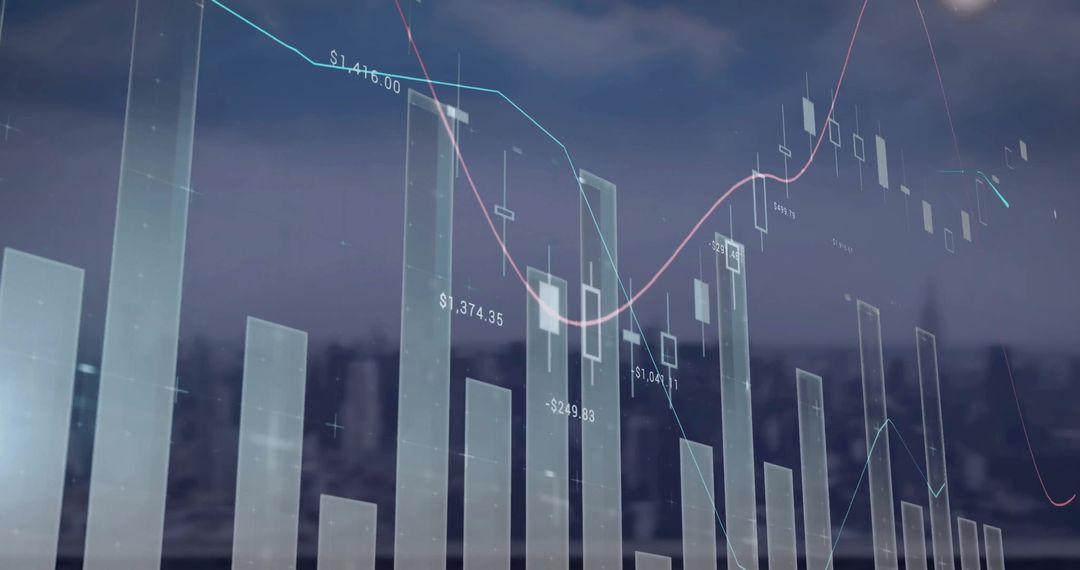
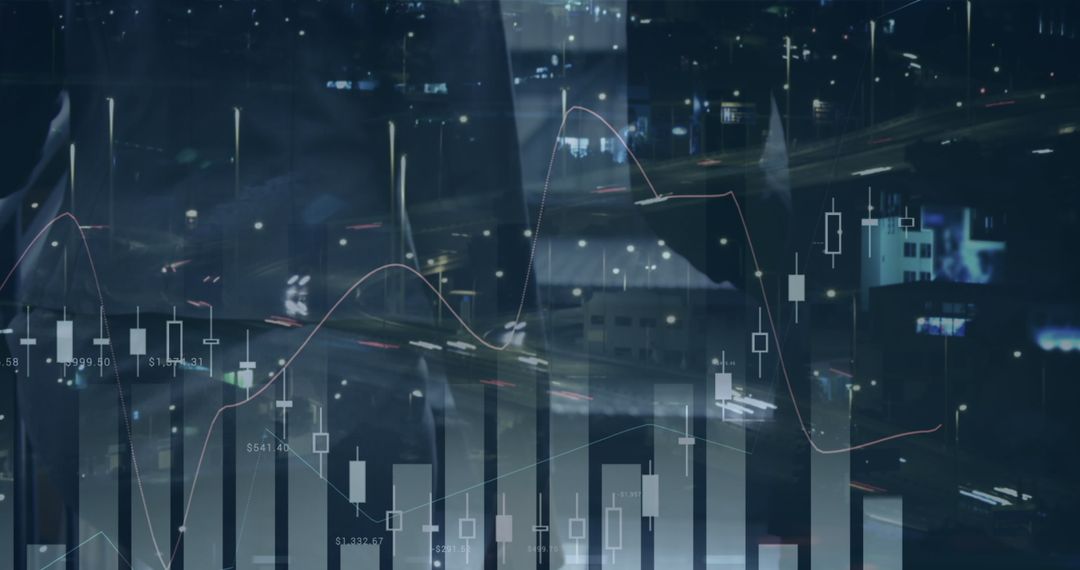
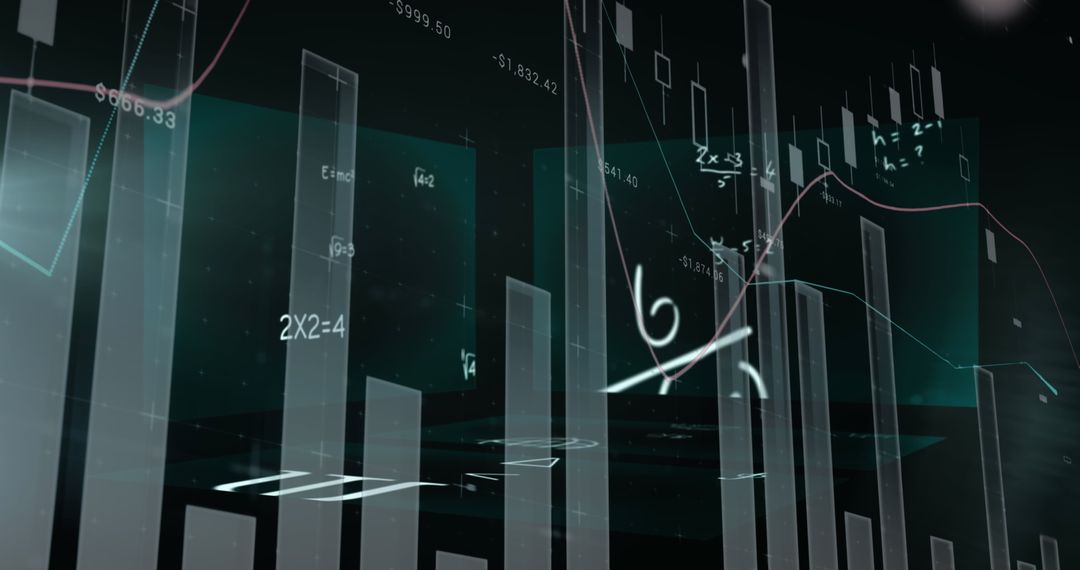
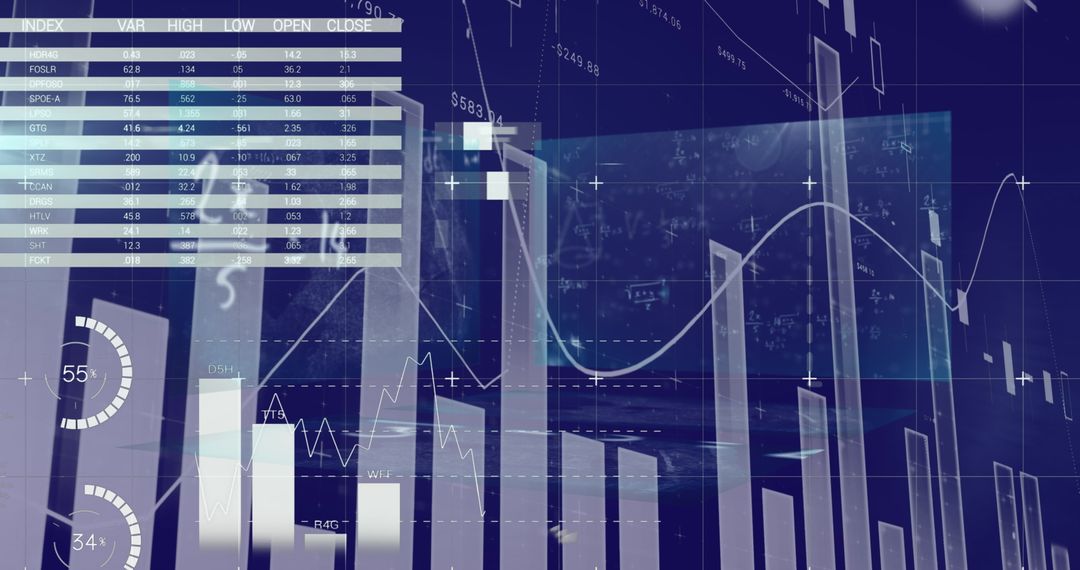
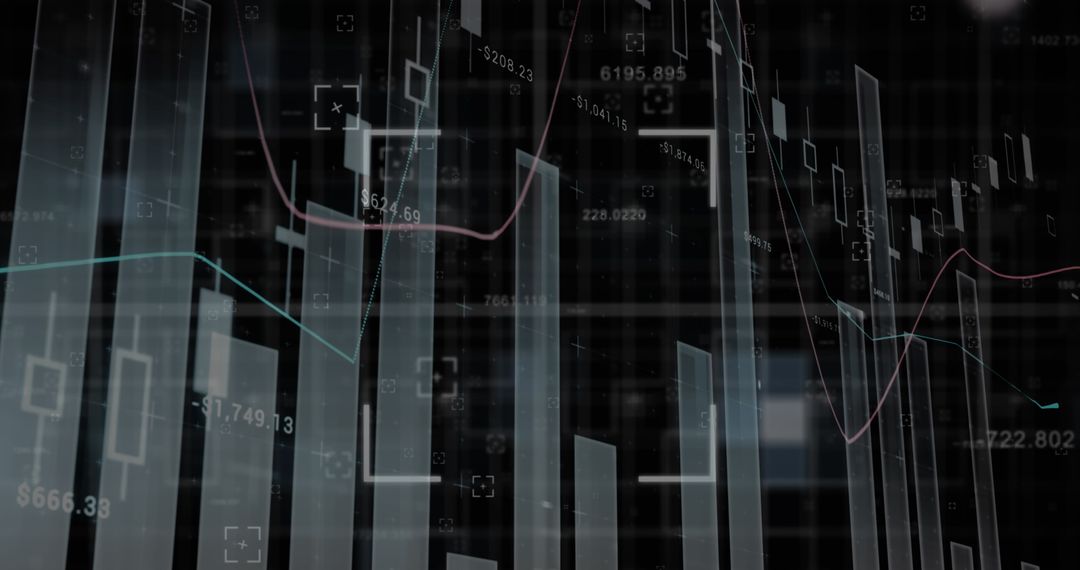
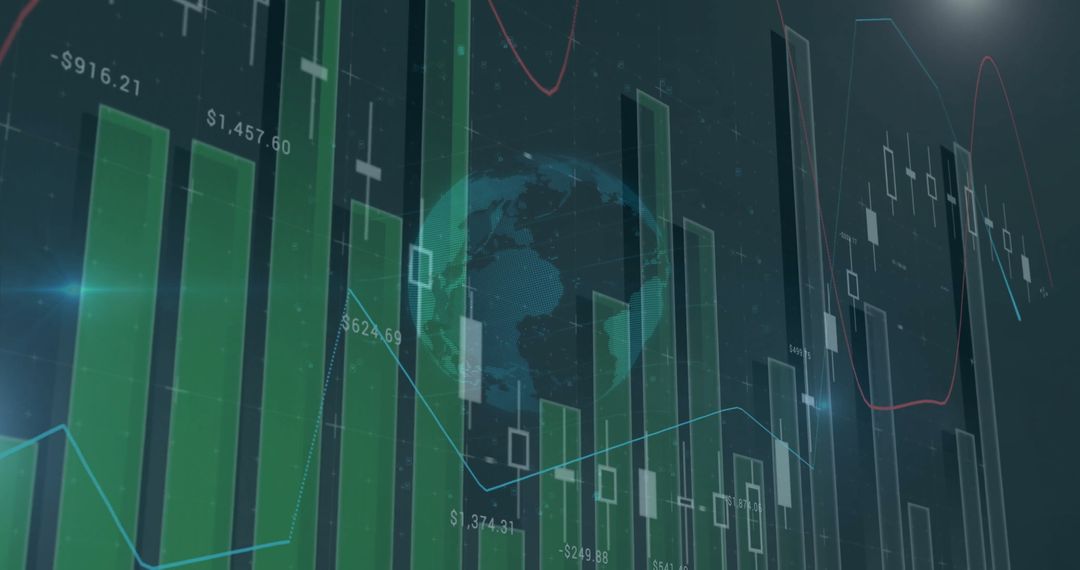
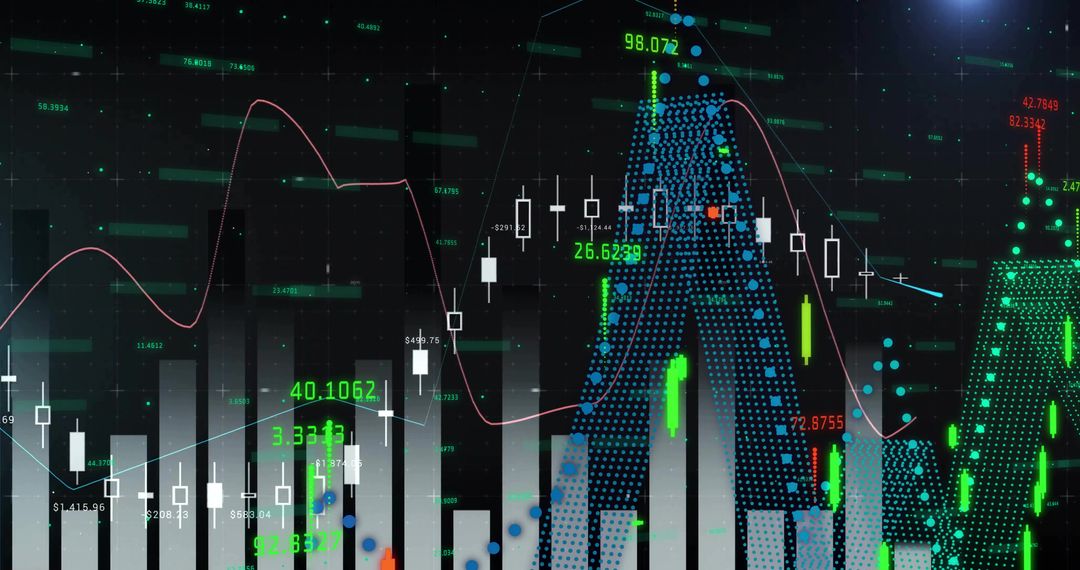
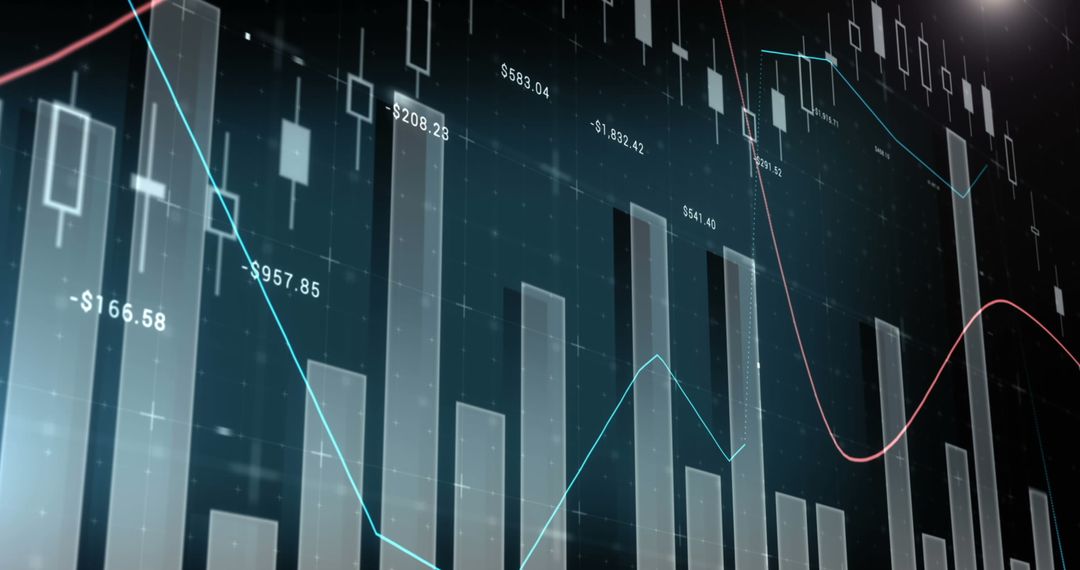
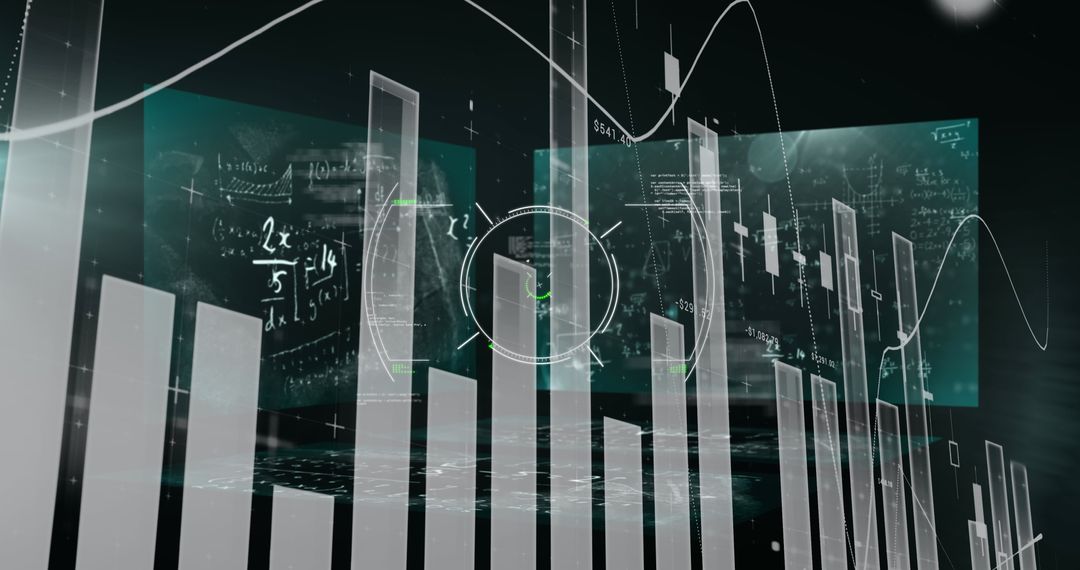
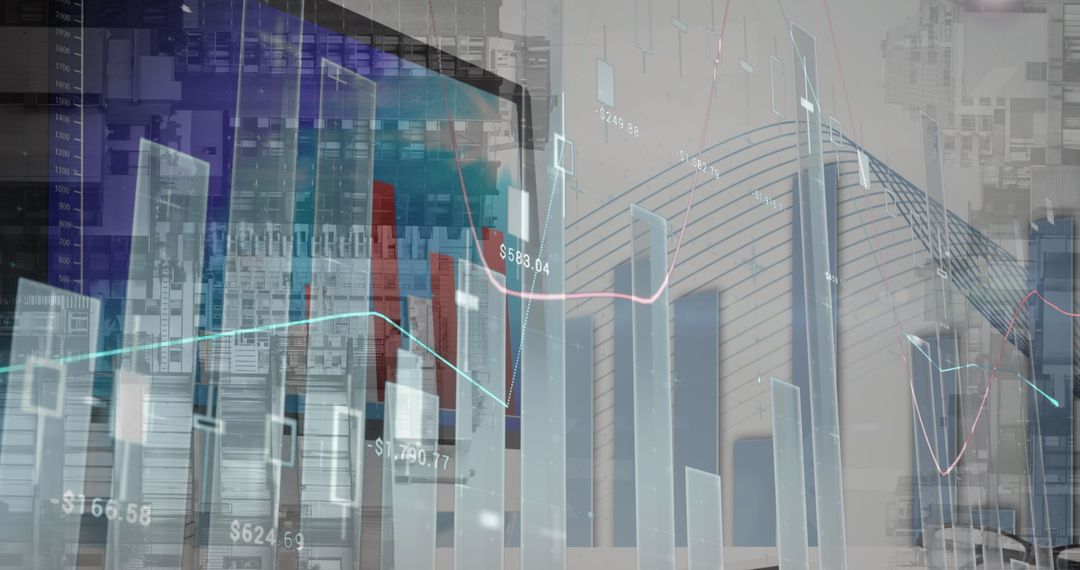
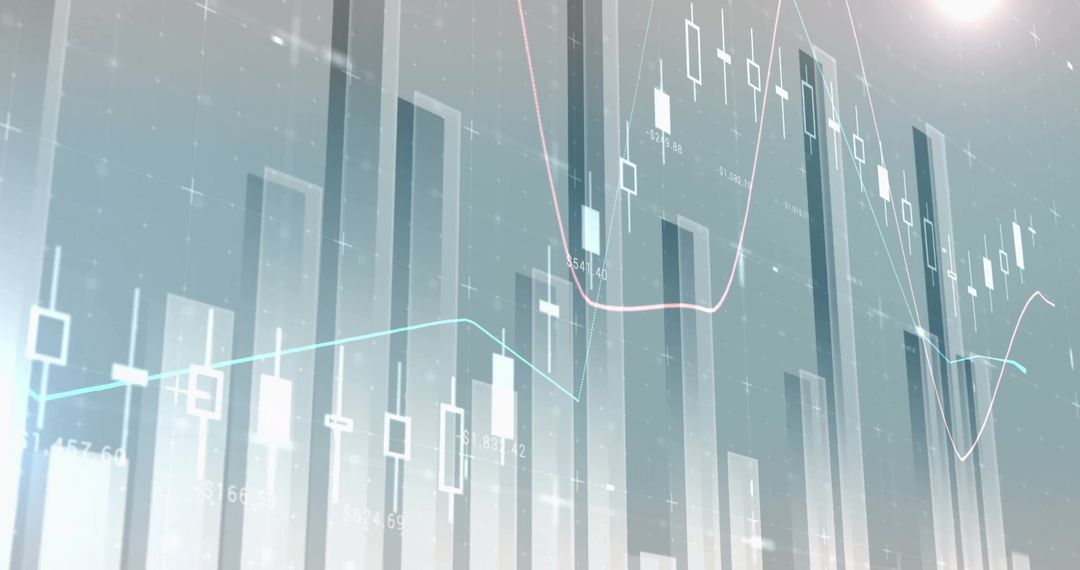
- Financial Chart with Candlestick Bars and Price Indicators
Financial Chart with Candlestick Bars and Price Indicators Image
This visual showcases a financial chart including candlestick bars and price labels, design elements used in technical analysis on trading platforms. Useful for presenting concepts in finance, technology, investment analytics, or educational content and training materials focused on financial markets.
Powered by  - Get 15% off with code: PIKWIZARD15


0
downloads
downloads
Tags:
More
Credit Photo
If you would like to credit the Photo, here are some ways you can do so
Text Link
photo Link
<span class="text-link">
<span>
<a target="_blank" href=https://pikwizard.com/photo/financial-chart-with-candlestick-bars-and-price-indicators/393ffa440da9240d8efe90674dffefbd/>PikWizard</a>
</span>
</span>
<span class="image-link">
<span
style="margin: 0 0 20px 0; display: inline-block; vertical-align: middle; width: 100%;"
>
<a
target="_blank"
href="https://pikwizard.com/photo/financial-chart-with-candlestick-bars-and-price-indicators/393ffa440da9240d8efe90674dffefbd/"
style="text-decoration: none; font-size: 10px; margin: 0;"
>
<img src="https://pikwizard.com/pw/medium/393ffa440da9240d8efe90674dffefbd.jpg" style="margin: 0; width: 100%;" alt="" />
<p style="font-size: 12px; margin: 0;">PikWizard</p>
</a>
</span>
</span>
Free (free of charge)
Free for personal and commercial use.
Author: Awesome Content
Similar Free Stock Images
Premium


Premium

Premium
Premium


Premium


Premium


Premium


Premium


Premium


Premium

Premium


Premium

Premium


Premium


Premium


Premium


Premium

Premium


Premium

Premium


Premium


Premium


Premium


Premium