
- Home >
- Stock Photos >
- Financial Chart with Yellow Candlesticks and Trend Lines
Financial Chart with Yellow Candlesticks and Trend Lines Image
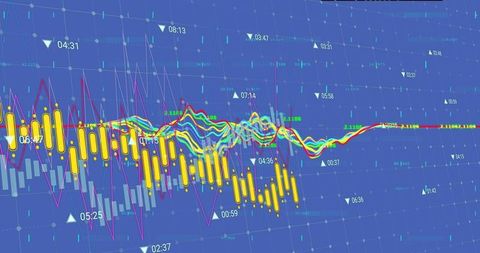
Financial trading chart displays complex data visualization with yellow candlestick bars. Magenta trend line provides insights into market movements. Perfect for use in finance articles, investment presentations, or educational materials. Enhances understanding of trading analytics and financial forecasting.
Powered by 


0
downloads
downloads
Tags:
More
Credit Photo
If you would like to credit the Photo, here are some ways you can do so
Text Link
photo Link
<span class="text-link">
<span>
<a target="_blank" href=https://pikwizard.com/photo/financial-chart-with-yellow-candlesticks-and-trend-lines/12efb3402c7c3cd5dfd4eca4593c14a4/>PikWizard</a>
</span>
</span>
<span class="image-link">
<span
style="margin: 0 0 20px 0; display: inline-block; vertical-align: middle; width: 100%;"
>
<a
target="_blank"
href="https://pikwizard.com/photo/financial-chart-with-yellow-candlesticks-and-trend-lines/12efb3402c7c3cd5dfd4eca4593c14a4/"
style="text-decoration: none; font-size: 10px; margin: 0;"
>
<img src="https://pikwizard.com/pw/medium/12efb3402c7c3cd5dfd4eca4593c14a4.jpg" style="margin: 0; width: 100%;" alt="" />
<p style="font-size: 12px; margin: 0;">PikWizard</p>
</a>
</span>
</span>
Free (free of charge)
Free for personal and commercial use.
Author: Creative Art