- Home >
- Stock Photos >
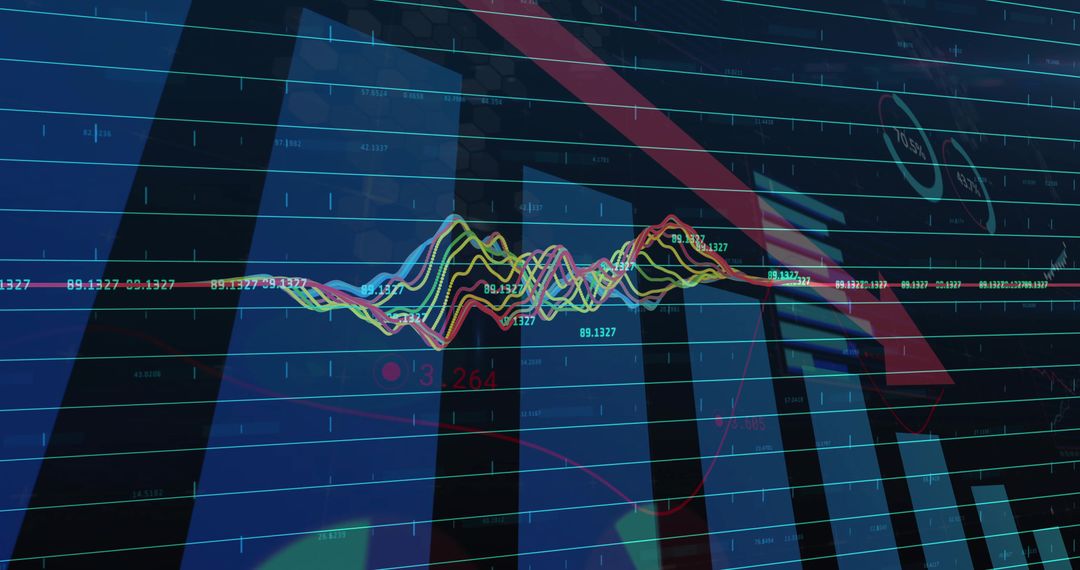
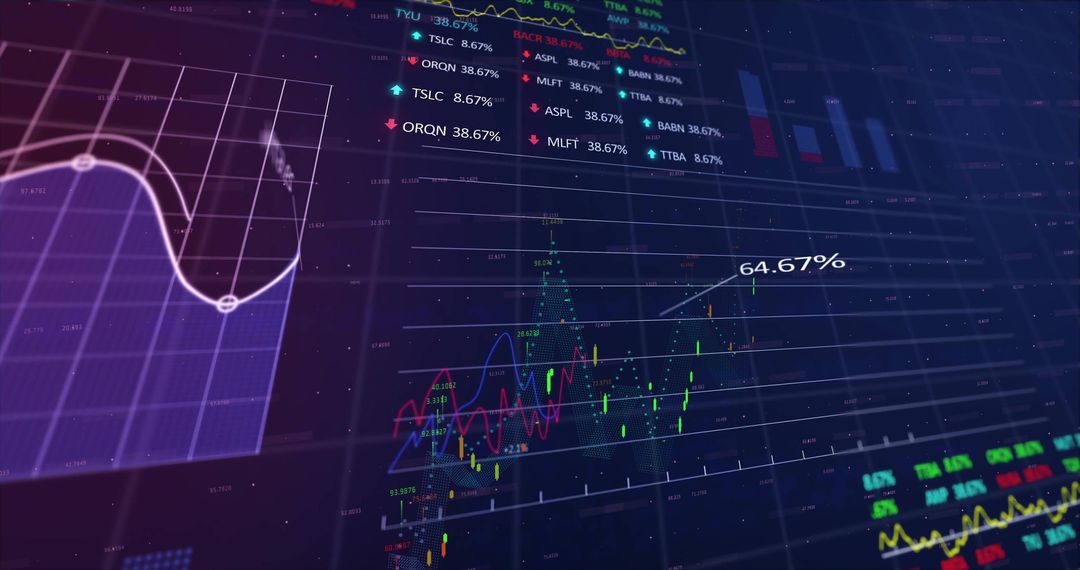
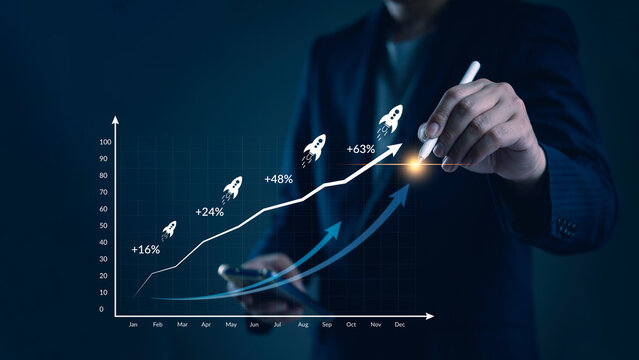
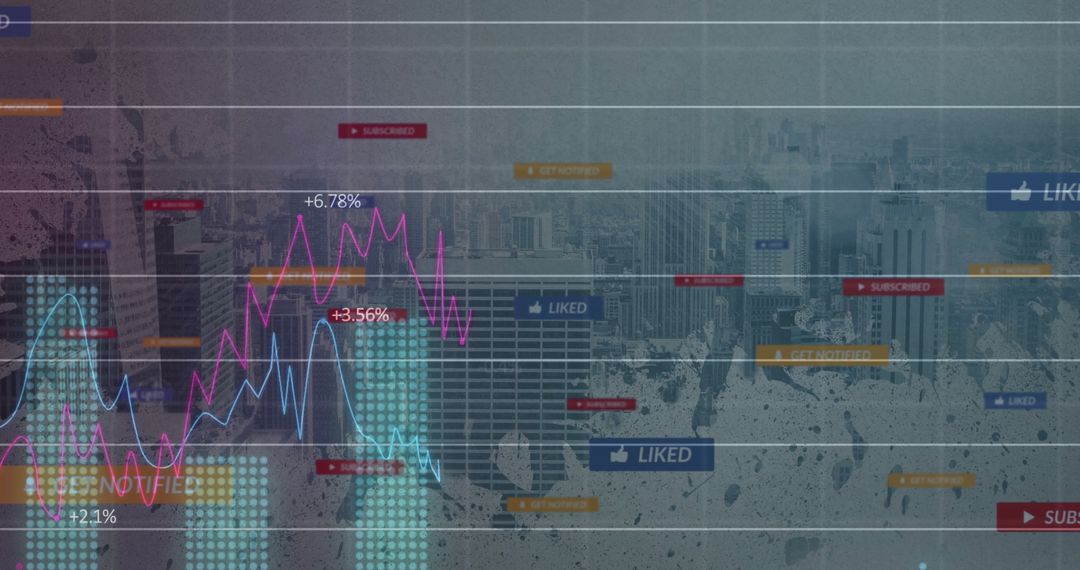
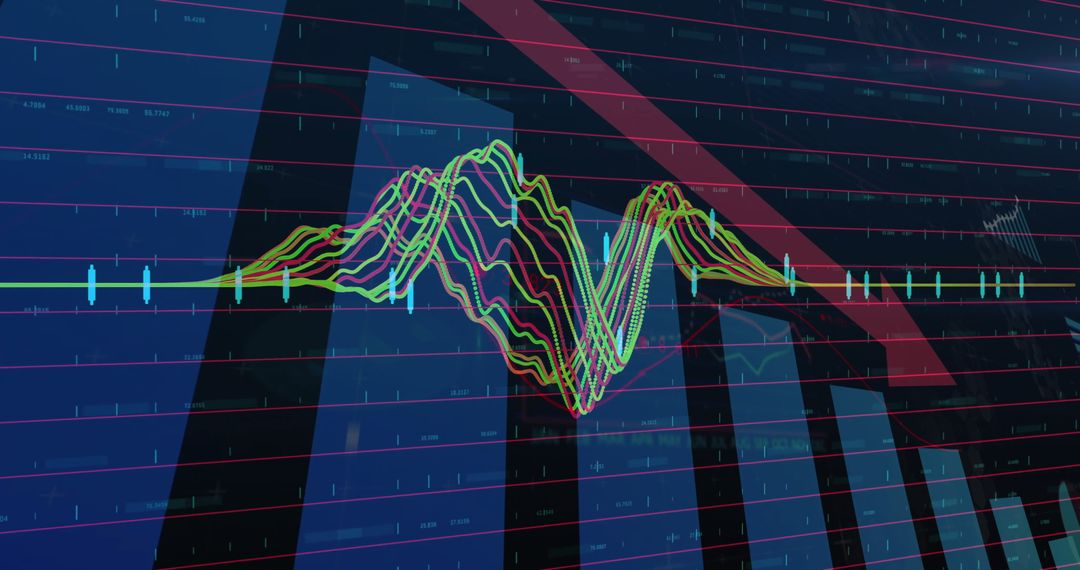
- Financial Dashboard KPI Trends With Downward Arrow and Performance Data
Financial Dashboard KPI Trends With Downward Arrow and Performance Data Image
Dashboard showing financial data trends with emphasis on a red downward arrow overlaid on bar charts and colorful data lines. This highlights insight into market or performance metrics downturns which might be used in presentations about financial analysis or business reviews. Essential for discussions on market volatility, company performance metrics, or investment strategy adaption.
Powered by 


0
downloads
downloads
Tags:
More
Credit Photo
If you would like to credit the Photo, here are some ways you can do so
Text Link
photo Link
<span class="text-link">
<span>
<a target="_blank" href=https://pikwizard.com/photo/financial-dashboard-kpi-trends-with-downward-arrow-and-performance-data/9de8cd1450bbcb581df4b90bdee67382/>PikWizard</a>
</span>
</span>
<span class="image-link">
<span
style="margin: 0 0 20px 0; display: inline-block; vertical-align: middle; width: 100%;"
>
<a
target="_blank"
href="https://pikwizard.com/photo/financial-dashboard-kpi-trends-with-downward-arrow-and-performance-data/9de8cd1450bbcb581df4b90bdee67382/"
style="text-decoration: none; font-size: 10px; margin: 0;"
>
<img src="https://pikwizard.com/pw/medium/9de8cd1450bbcb581df4b90bdee67382.jpg" style="margin: 0; width: 100%;" alt="" />
<p style="font-size: 12px; margin: 0;">PikWizard</p>
</a>
</span>
</span>
Free (free of charge)
Free for personal and commercial use.
Author: Awesome Content
Similar Free Stock Images

Premium


Premium


Premium


Premium


Premium


Premium


Premium


Premium


Premium


Premium


Premium


Premium


Premium


Premium


Premium


Premium


Premium


Premium


Premium


Premium


Premium


Premium


Premium


Premium