- Home >
- Stock Photos >
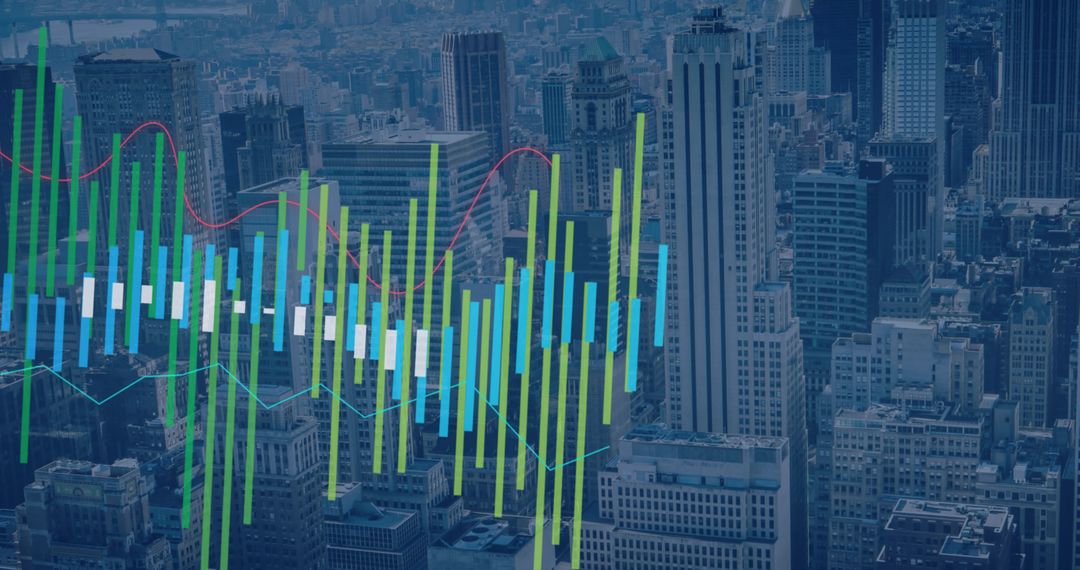
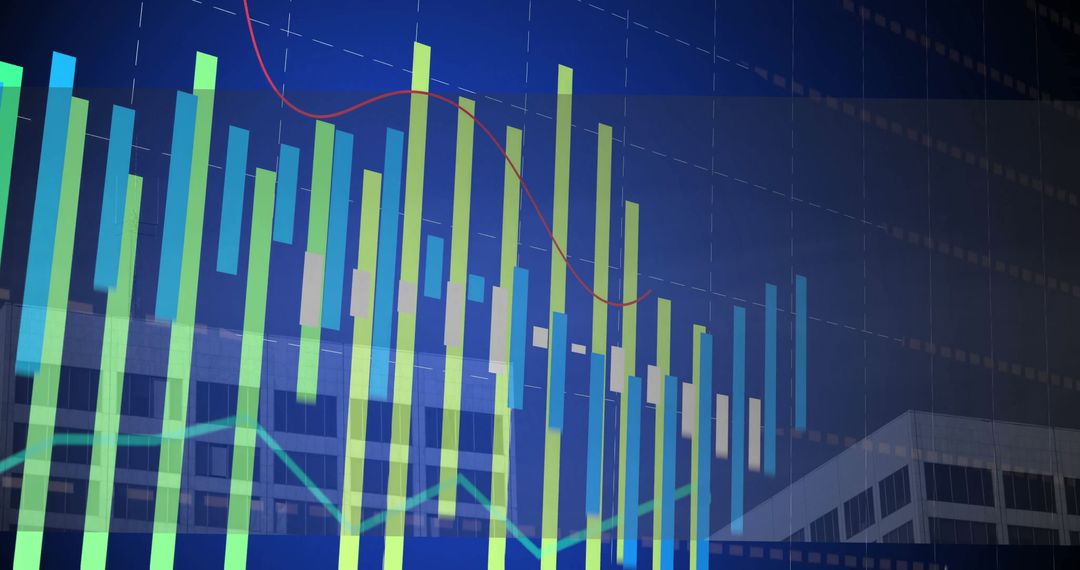
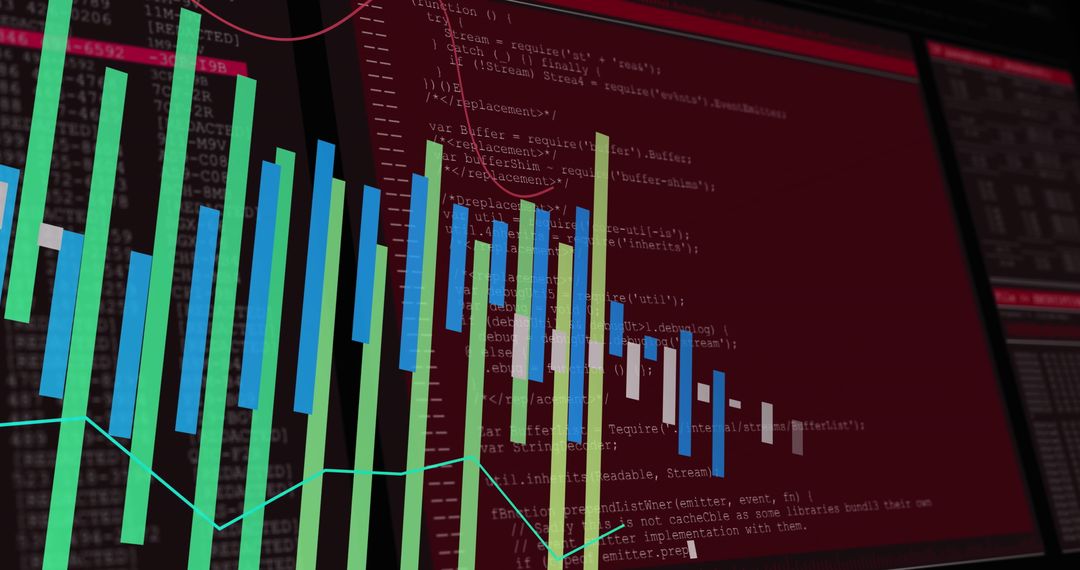
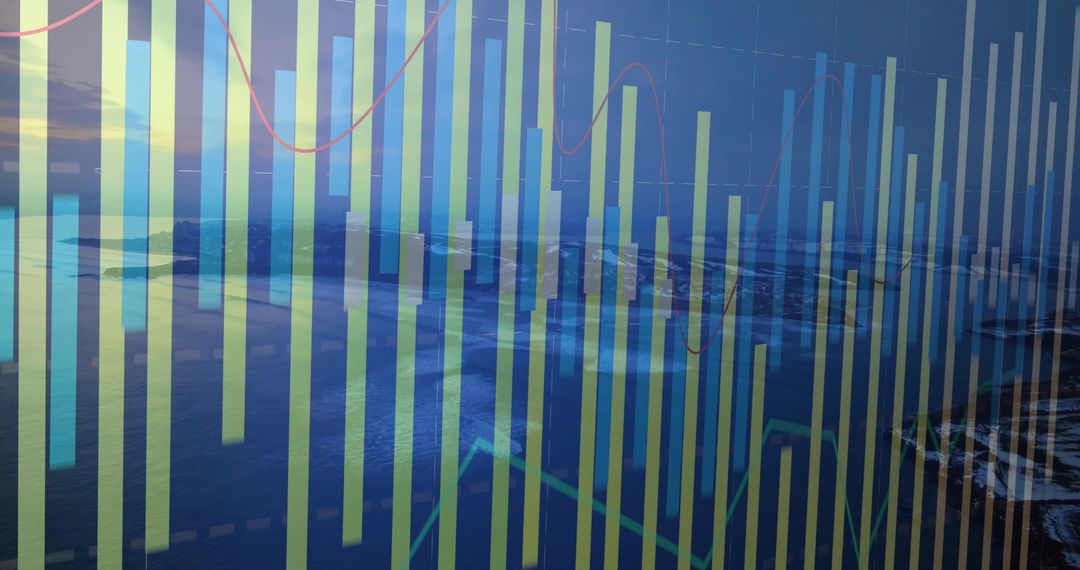
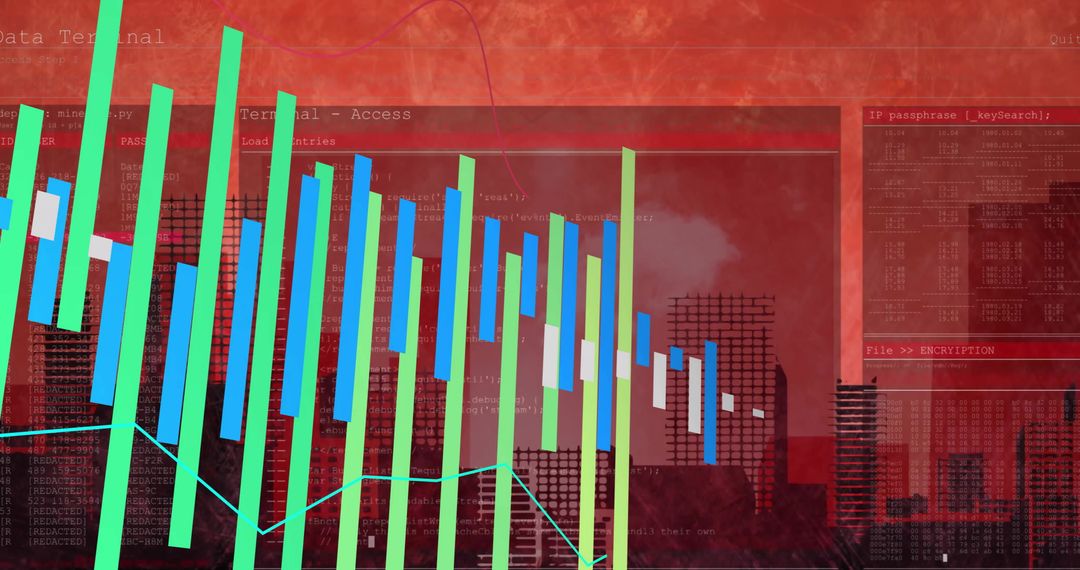
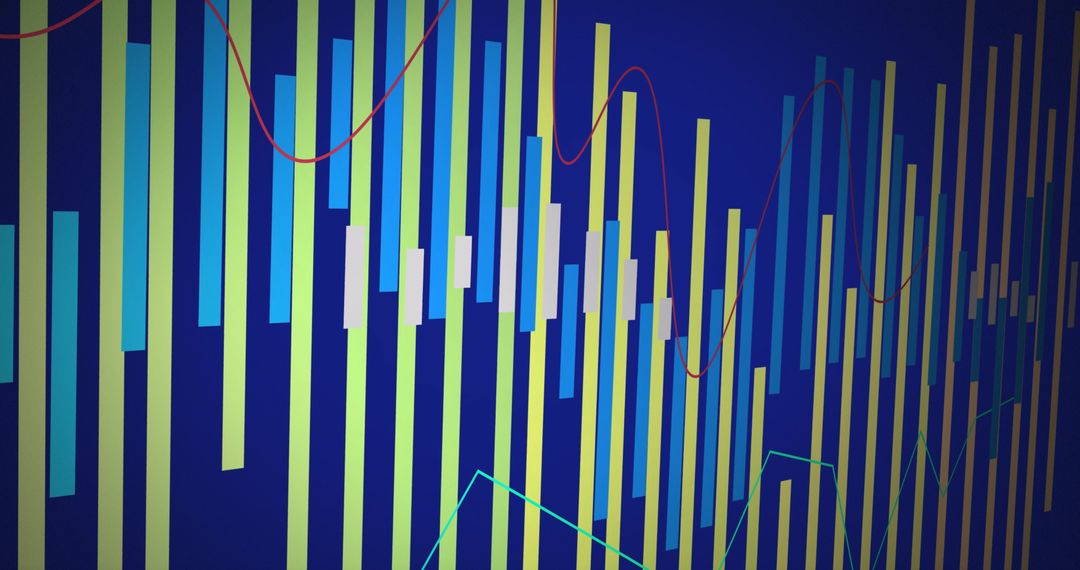
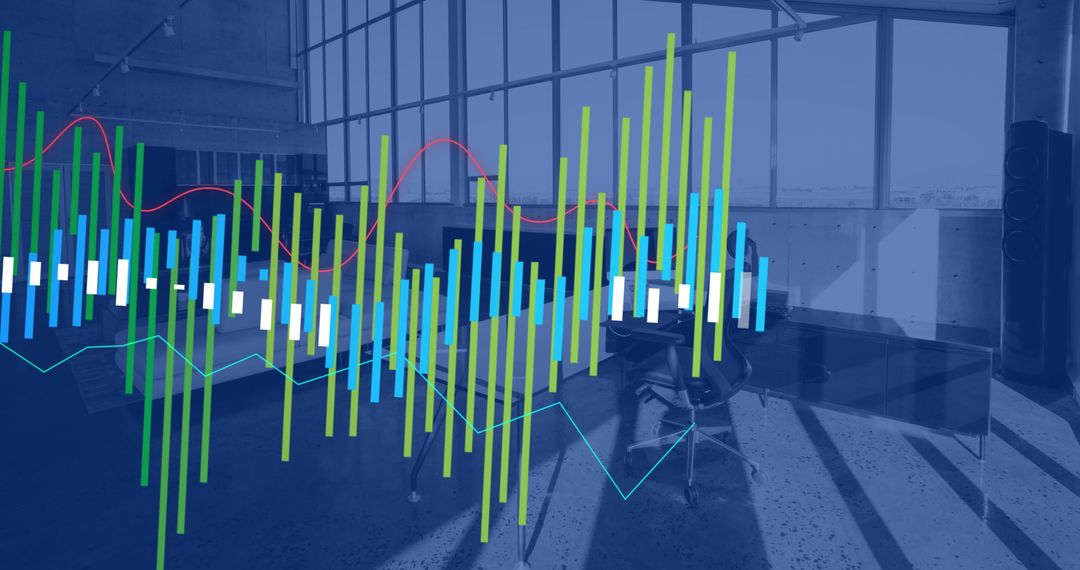
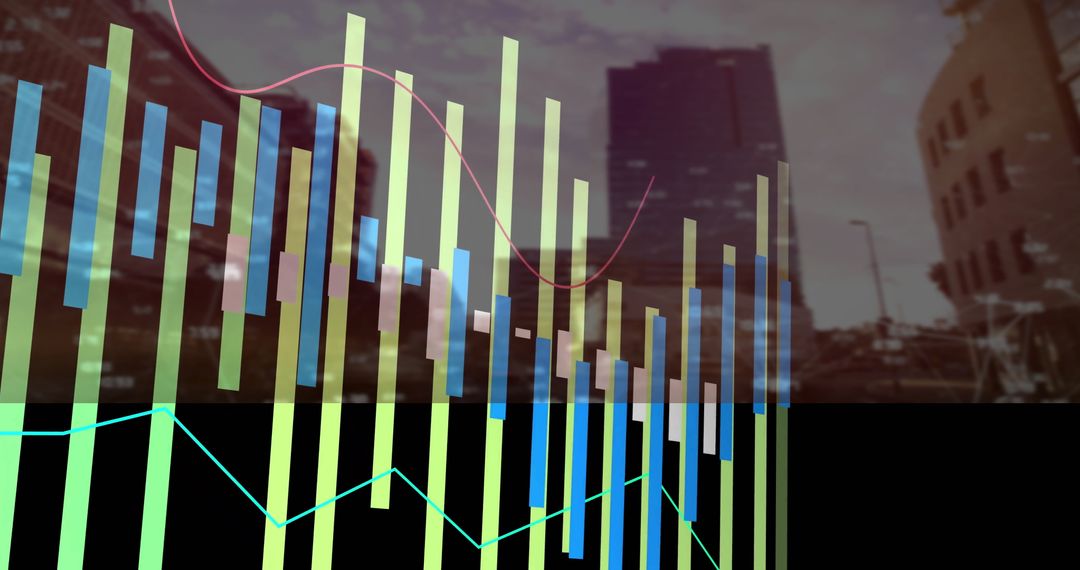
- Financial dashboard showing lime and cyan bars with red and teal trend lines
Financial dashboard showing lime and cyan bars with red and teal trend lines Image

Dark glossy background showing vertical lime and cyan bars with red and teal trend lines creating layered data visualization. High-contrast color palette emphasizing financial analytics and market momentum. Composition offering strong vertical rhythm and depth, serving dashboard headers, presentation slides, website hero banners, fintech marketing, social media posts, editorial design. Graphic elements providing space for overlaying headline text, KPI numbers, logos. Useful for illustrating stock performance, trading analytics, business intelligence reports, investment strategy, real-time monitoring. Suggesting cropping for hero banner or using full bleed for print collateral. Color palette complementing modern UI designs and tech branding. Suitable for commercial presentations, pitch decks, blog illustrations, advertising, background for video overlays.
Powered by 


0
downloads
downloads
Tags:
More
Credit Photo
If you would like to credit the Photo, here are some ways you can do so
Text Link
photo Link
<span class="text-link">
<span>
<a target="_blank" href=https://pikwizard.com/photo/financial-dashboard-showing-lime-and-cyan-bars-with-red-and-teal-trend-lines/0b7cabcd4e611015a0ae64b0dd0801f5/>PikWizard</a>
</span>
</span>
<span class="image-link">
<span
style="margin: 0 0 20px 0; display: inline-block; vertical-align: middle; width: 100%;"
>
<a
target="_blank"
href="https://pikwizard.com/photo/financial-dashboard-showing-lime-and-cyan-bars-with-red-and-teal-trend-lines/0b7cabcd4e611015a0ae64b0dd0801f5/"
style="text-decoration: none; font-size: 10px; margin: 0;"
>
<img src="https://pikwizard.com/pw/medium/0b7cabcd4e611015a0ae64b0dd0801f5.jpg" style="margin: 0; width: 100%;" alt="" />
<p style="font-size: 12px; margin: 0;">PikWizard</p>
</a>
</span>
</span>
Free (free of charge)
Free for personal and commercial use.
Author: Authentic Images
Similar Free Stock Images

Premium


Premium


Premium


Premium


Premium


Premium


Premium


Premium


Premium


Premium


Premium


Premium


Premium


Premium


Premium


Premium


Premium


Premium


Premium


Premium


Premium

Premium

Premium


Premium