- Home >
- Stock Photos >
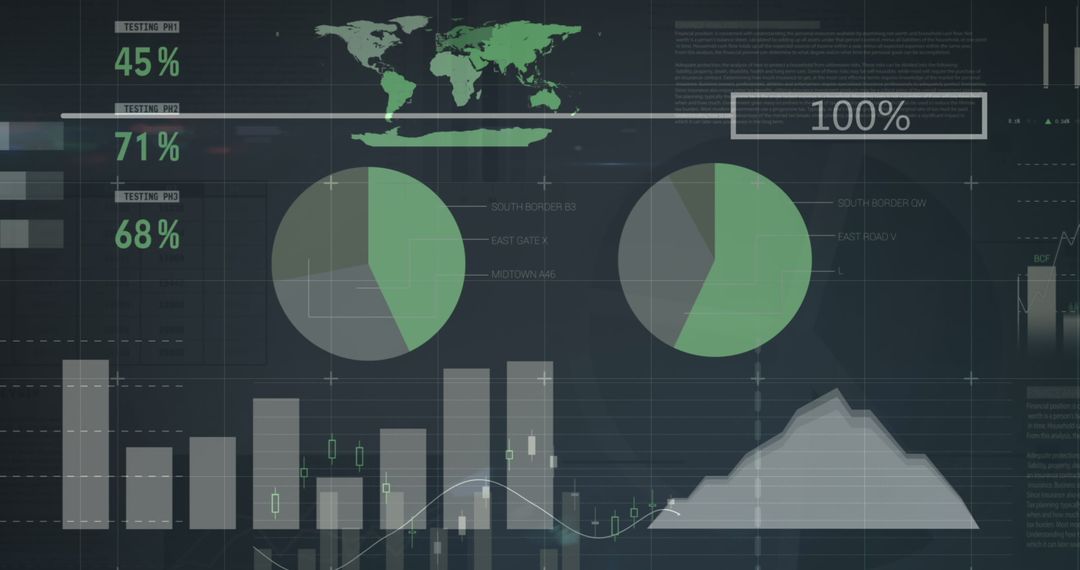
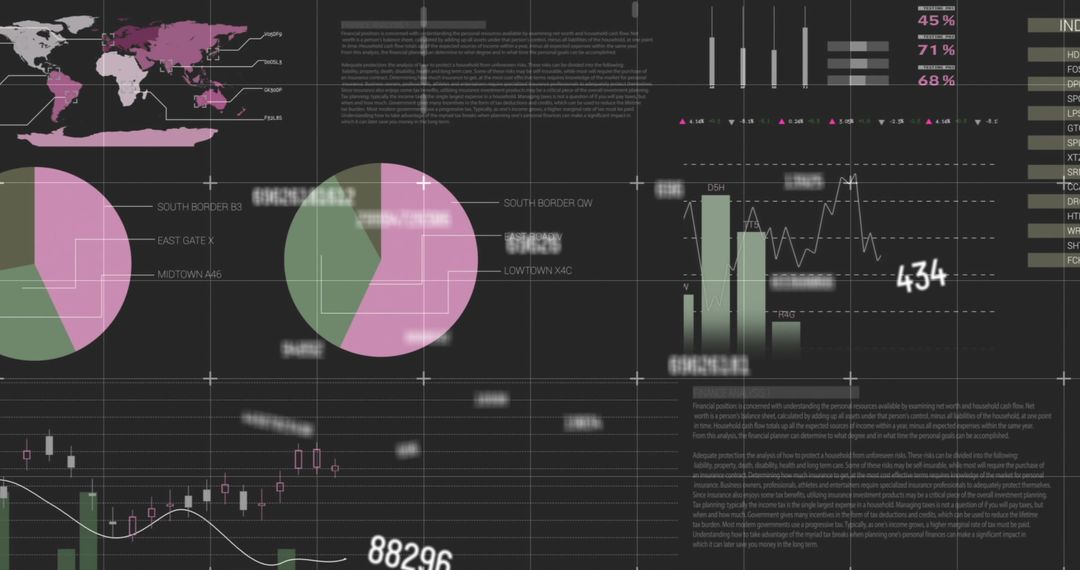
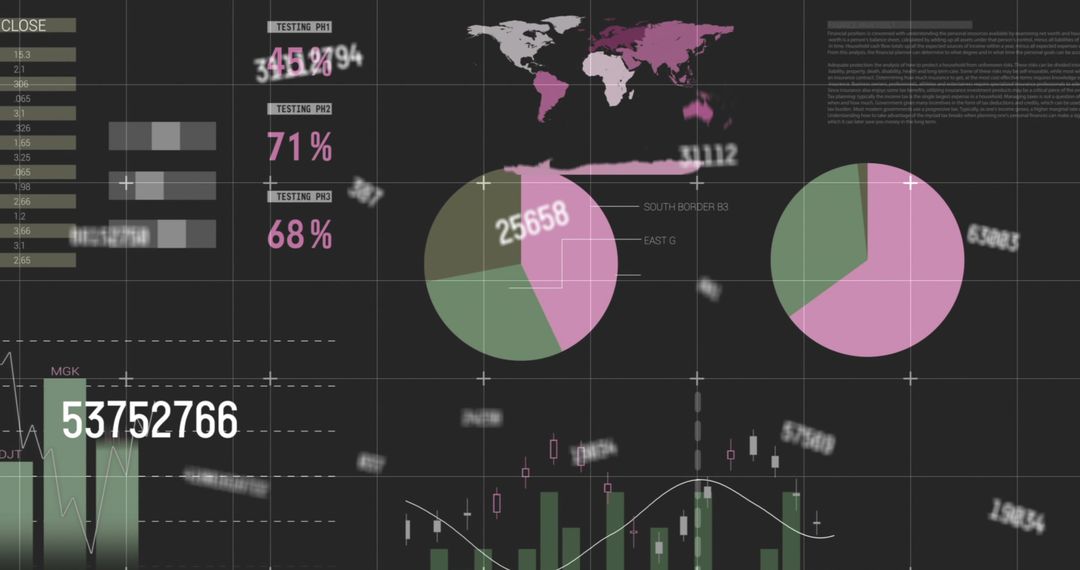
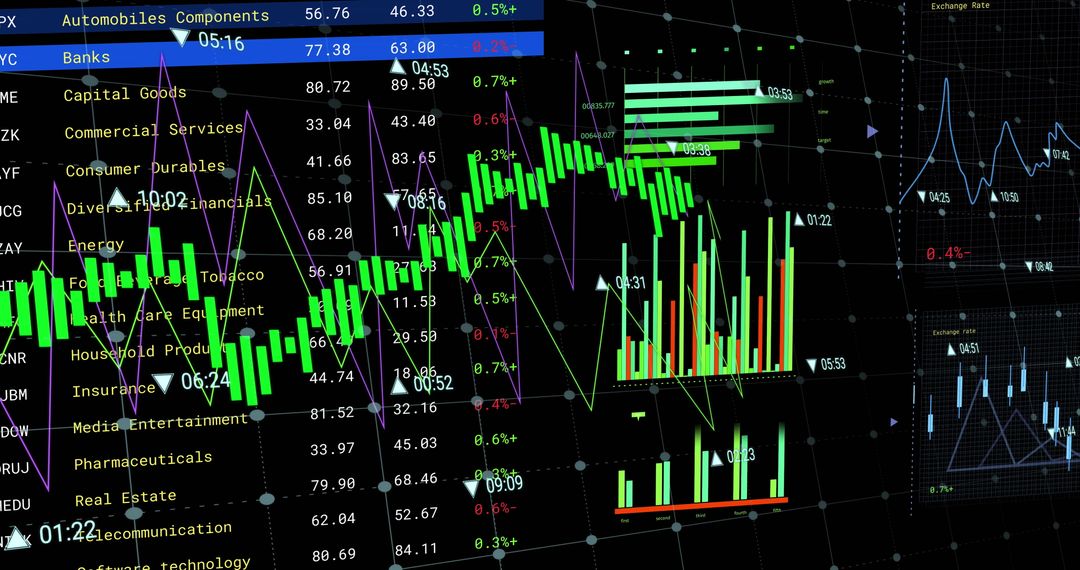
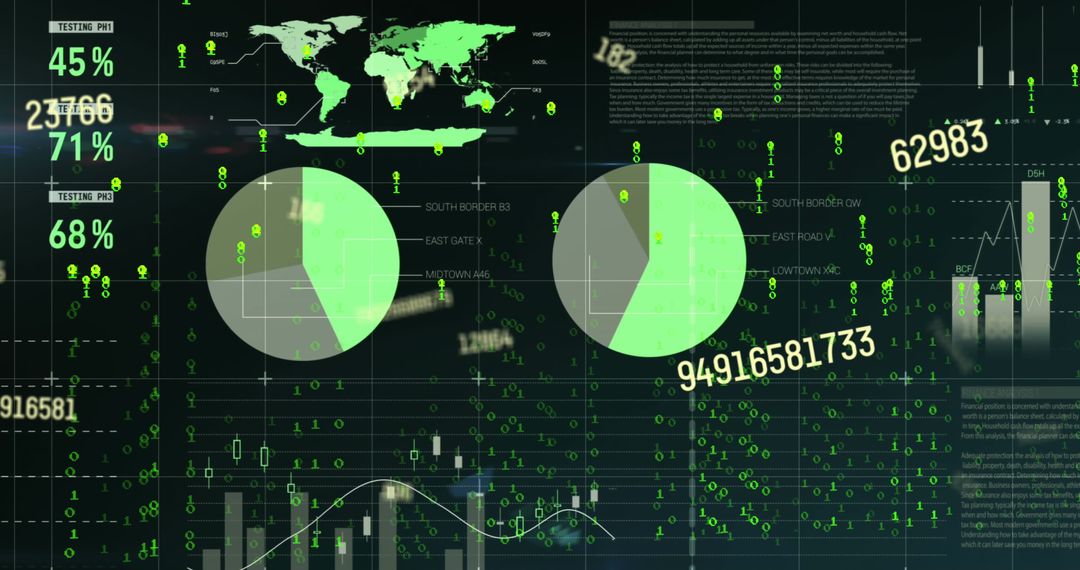
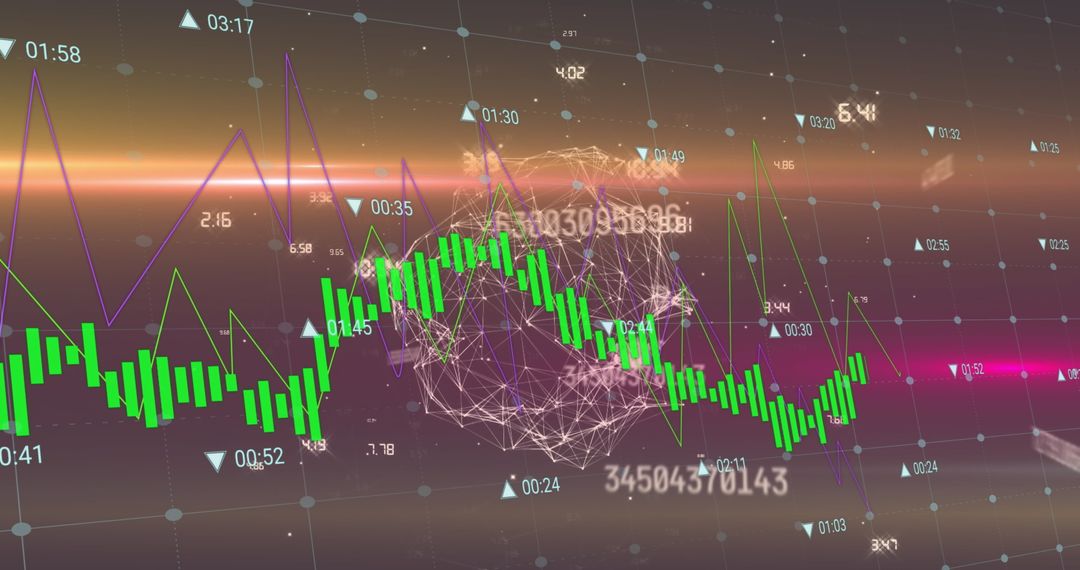
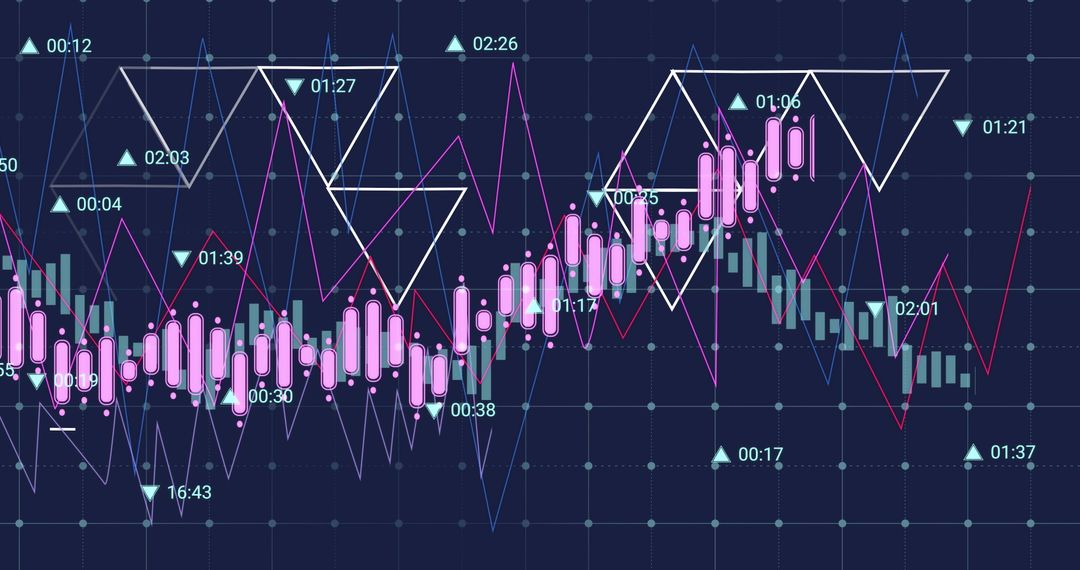
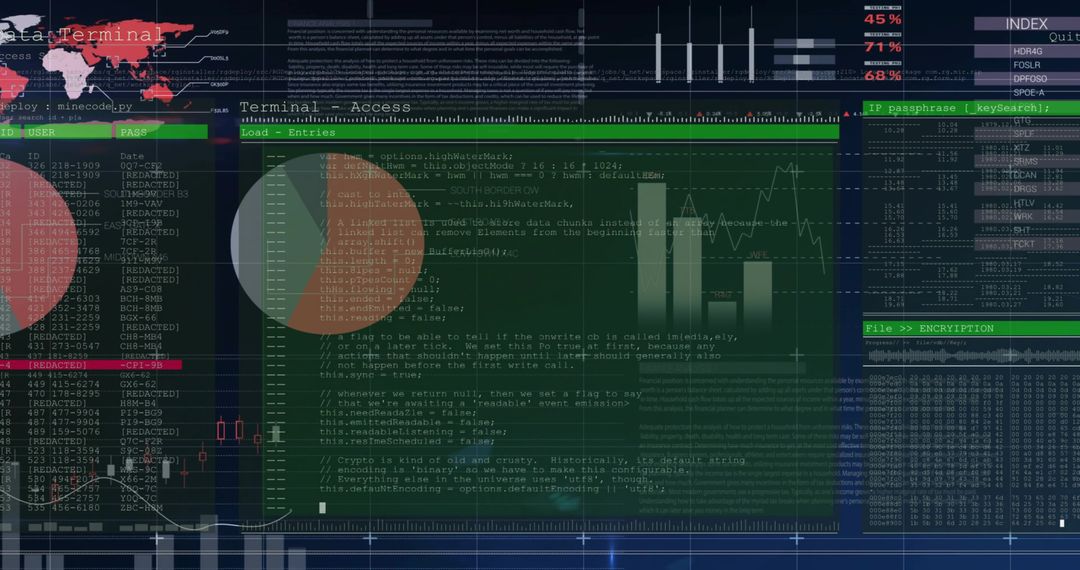
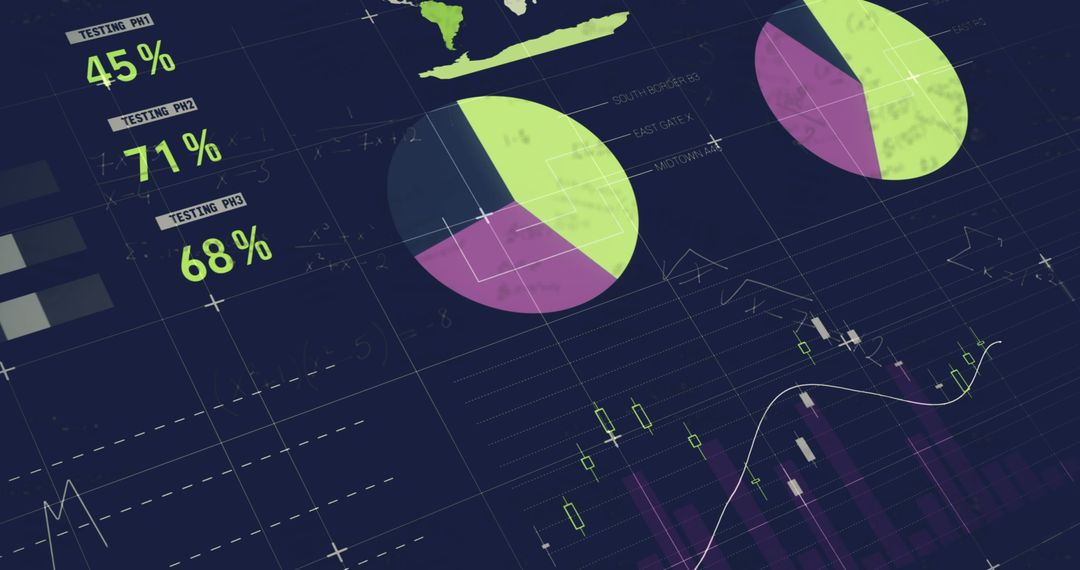
- Financial Dashboard with Line, Bar, and Candlestick Charts
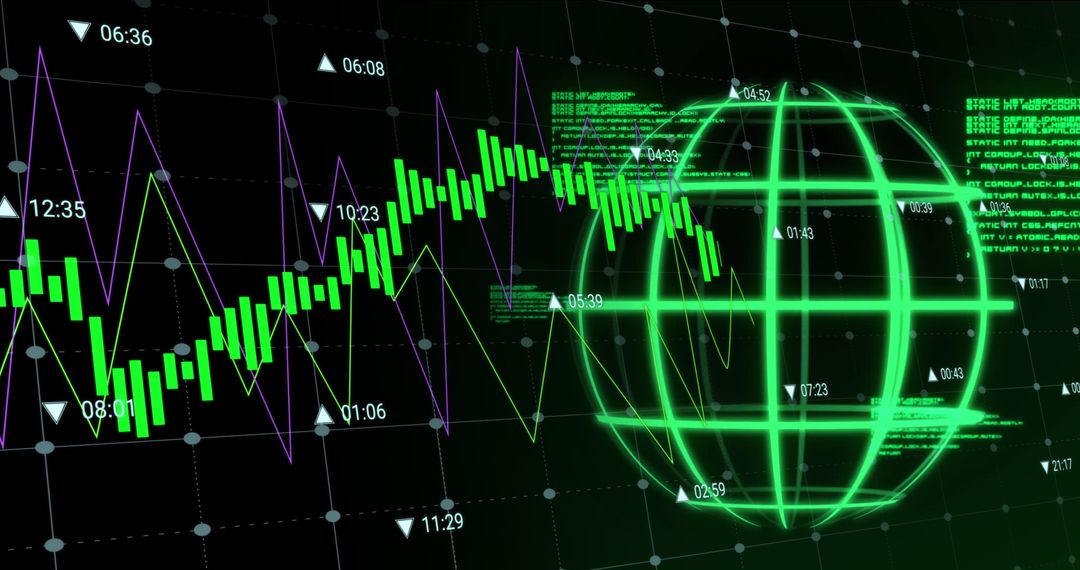
Financial Dashboard with Line, Bar, and Candlestick Charts Image
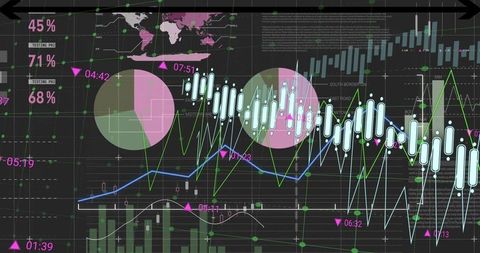
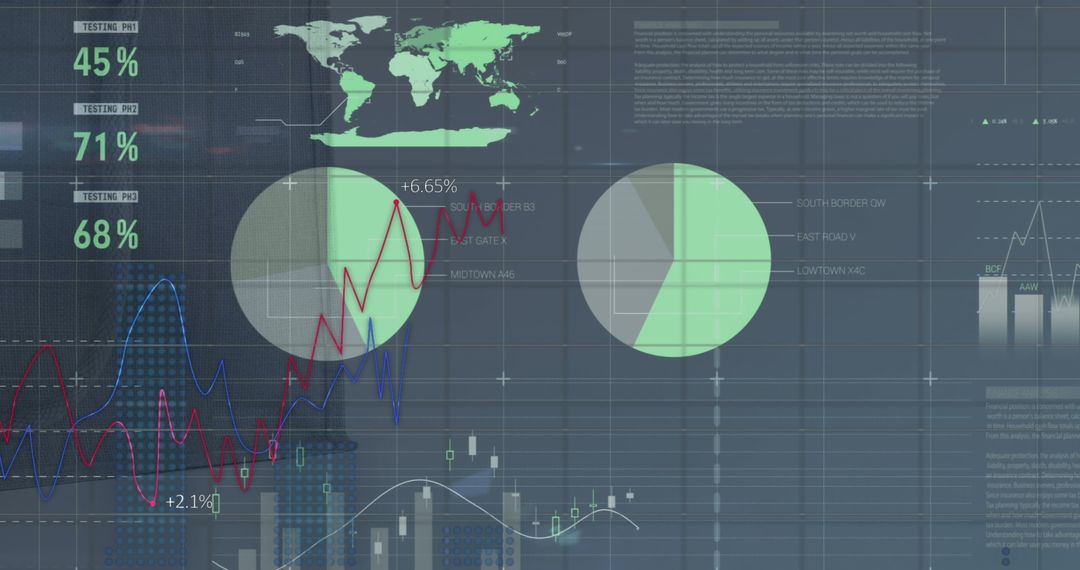
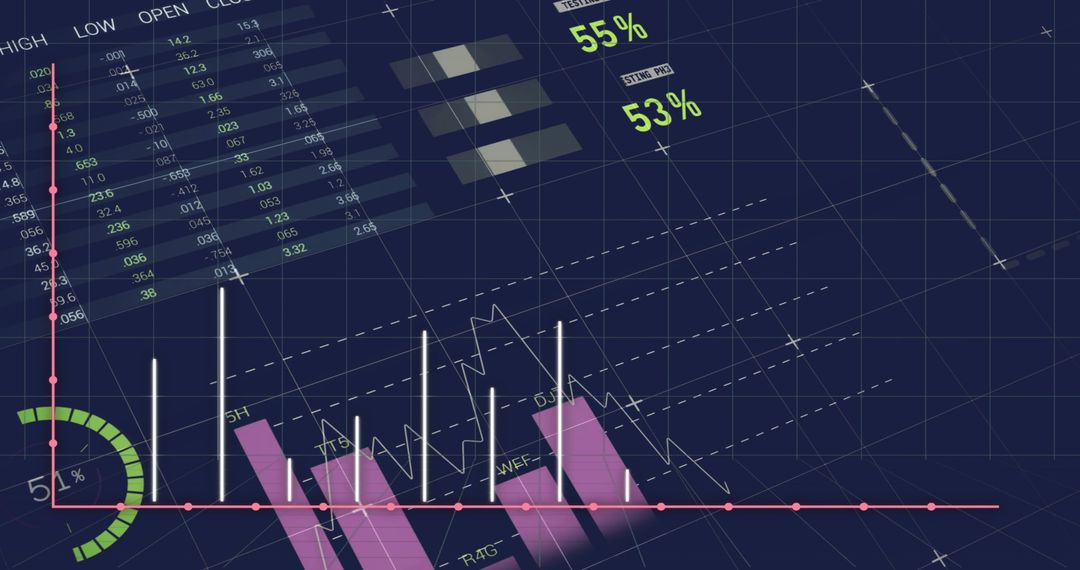
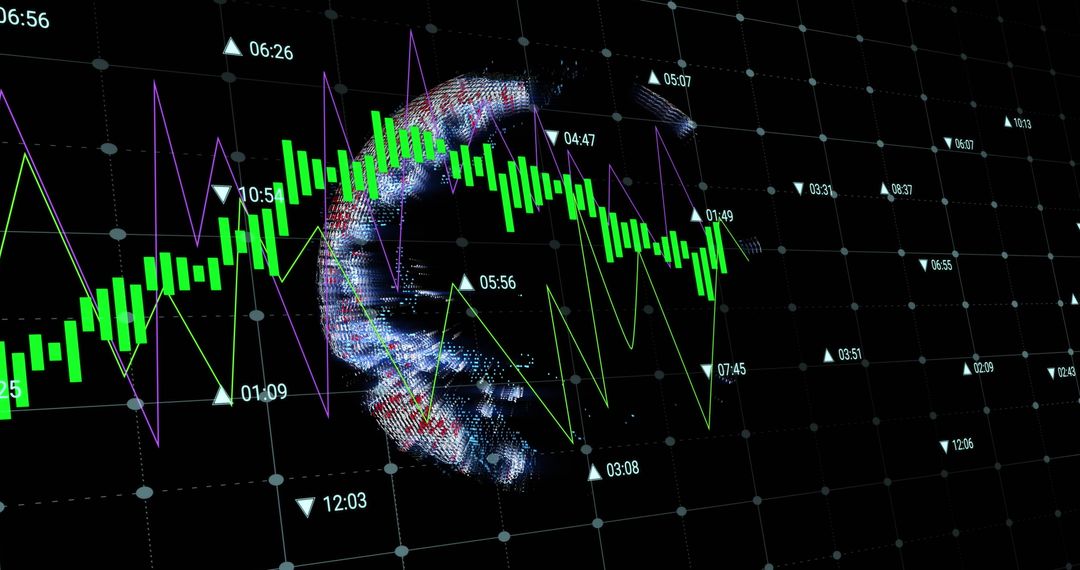
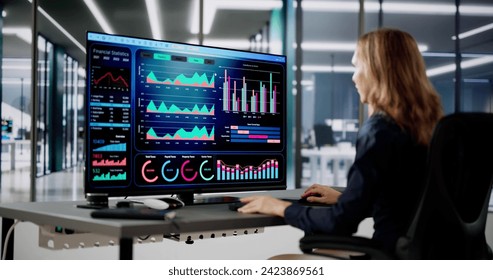
Dashboard illustrating financial data using a combination of charts, including candlestick, line, and bar graphs. High-tech presentation likely representing real-time market analysis, valuable for accountants, financial analysts, and stock market research. Beneficial illustration in presentations about investment trends, trading strategies, or as a background in financial tech platforms highlighting sleek, modern UI design.
Powered by  - Get 15% off with code: PIKWIZARD15


0
downloads
downloads
Tags:
More
Credit Photo
If you would like to credit the Photo, here are some ways you can do so
Text Link
photo Link
<span class="text-link">
<span>
<a target="_blank" href=https://pikwizard.com/photo/financial-dashboard-with-line-bar-and-candlestick-charts/0e0d7afbdc0e6b99d6cbc9226f04ad2a/>PikWizard</a>
</span>
</span>
<span class="image-link">
<span
style="margin: 0 0 20px 0; display: inline-block; vertical-align: middle; width: 100%;"
>
<a
target="_blank"
href="https://pikwizard.com/photo/financial-dashboard-with-line-bar-and-candlestick-charts/0e0d7afbdc0e6b99d6cbc9226f04ad2a/"
style="text-decoration: none; font-size: 10px; margin: 0;"
>
<img src="https://pikwizard.com/pw/medium/0e0d7afbdc0e6b99d6cbc9226f04ad2a.jpg" style="margin: 0; width: 100%;" alt="" />
<p style="font-size: 12px; margin: 0;">PikWizard</p>
</a>
</span>
</span>
Free (free of charge)
Free for personal and commercial use.
Author: Awesome Content
Similar Free Stock Images
Premium


Premium


Premium


Premium


Premium


Premium


Premium


Premium


Premium


Premium


Premium


Premium


Premium


Premium


Premium


Premium


Premium

Premium


Premium


Premium


Premium


Premium


Premium


Premium