- Home >
- Stock Photos >
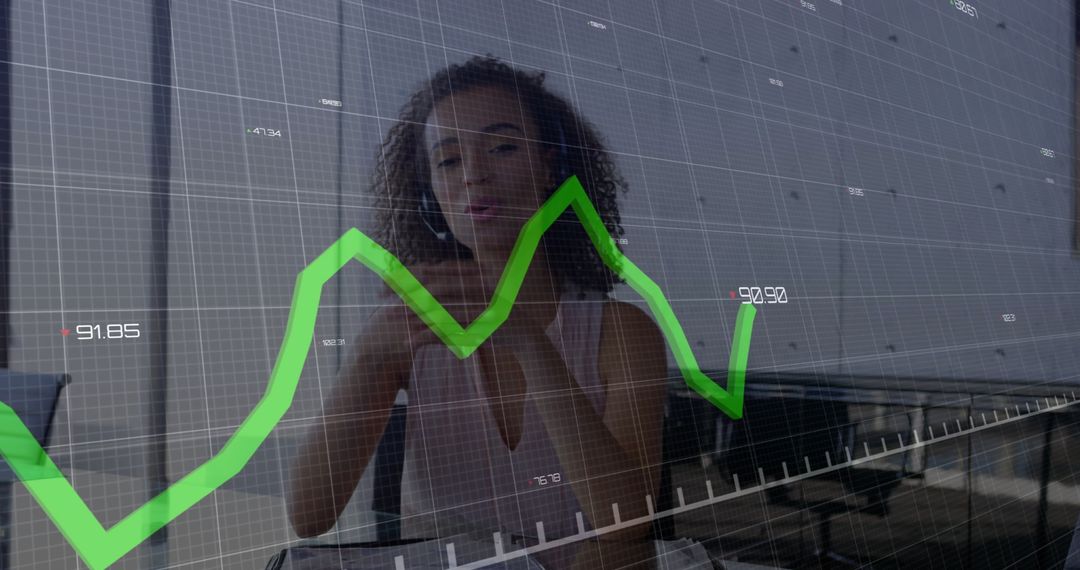
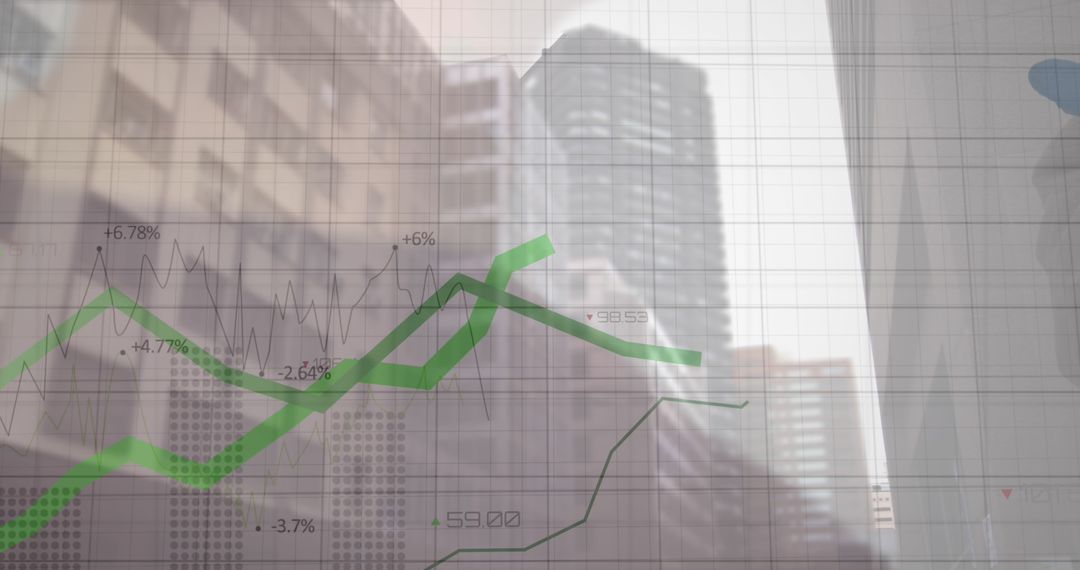
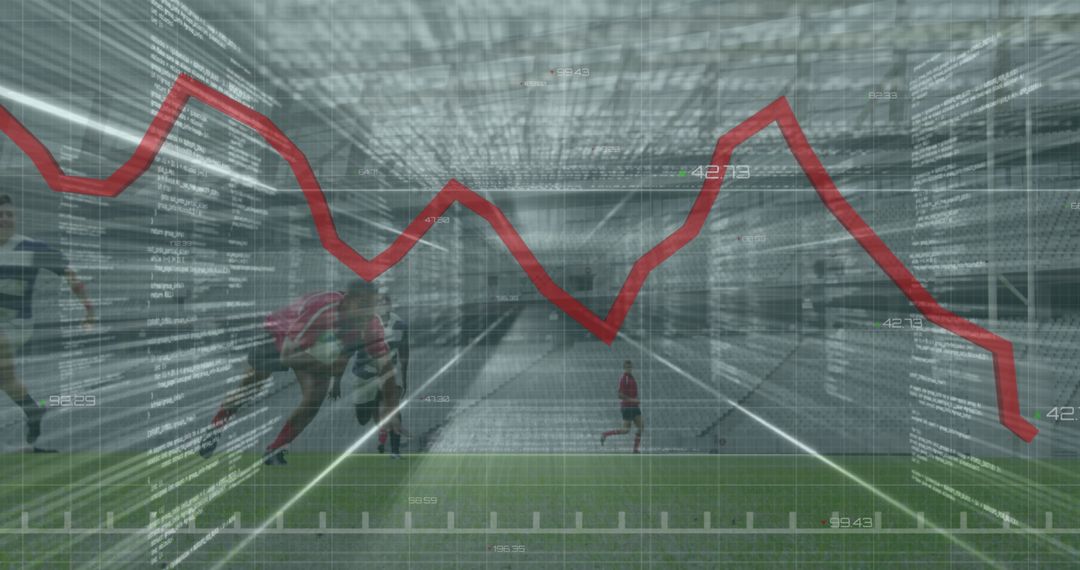
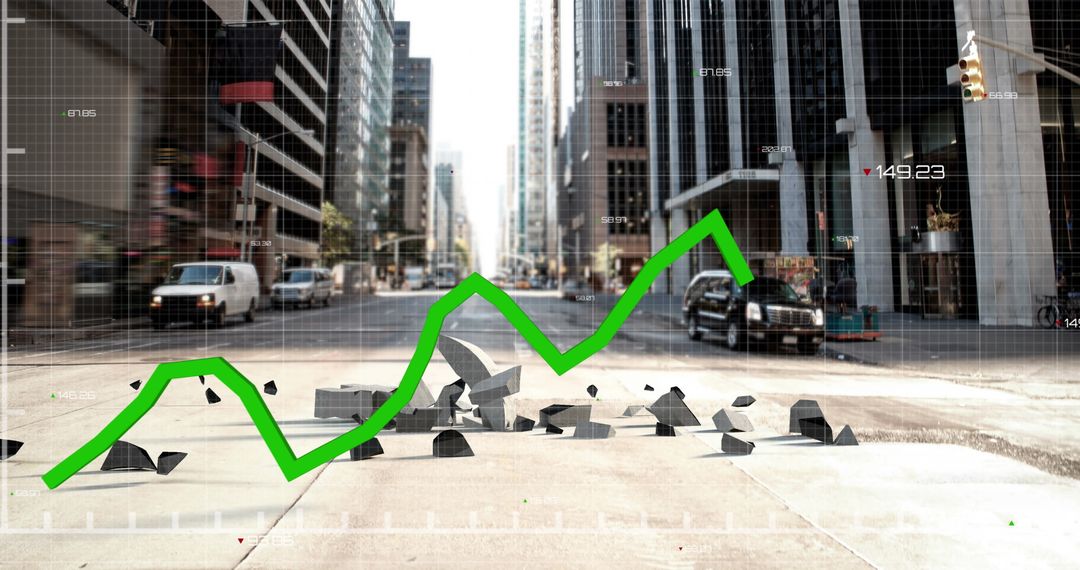
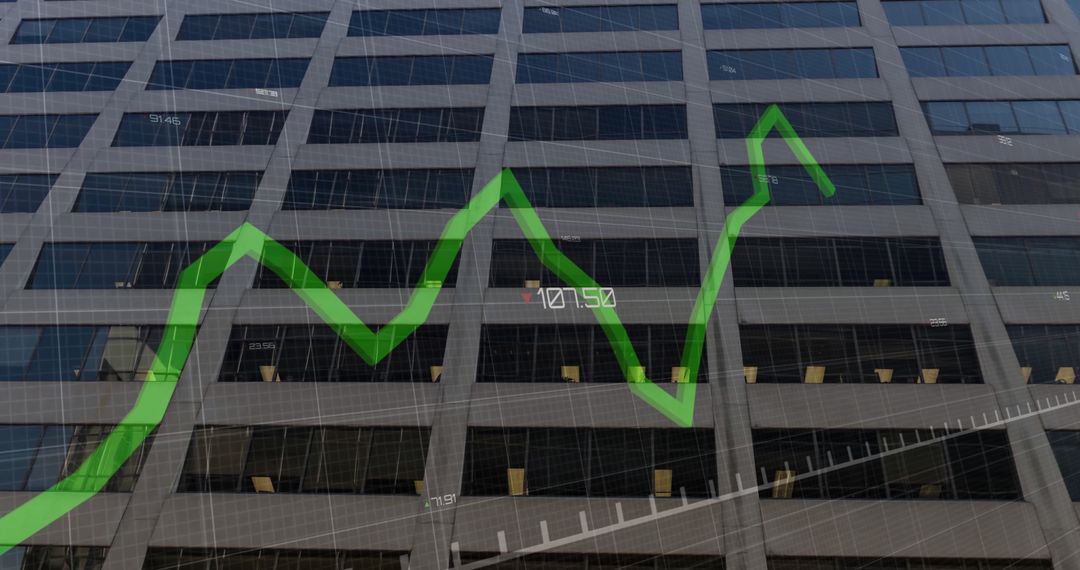
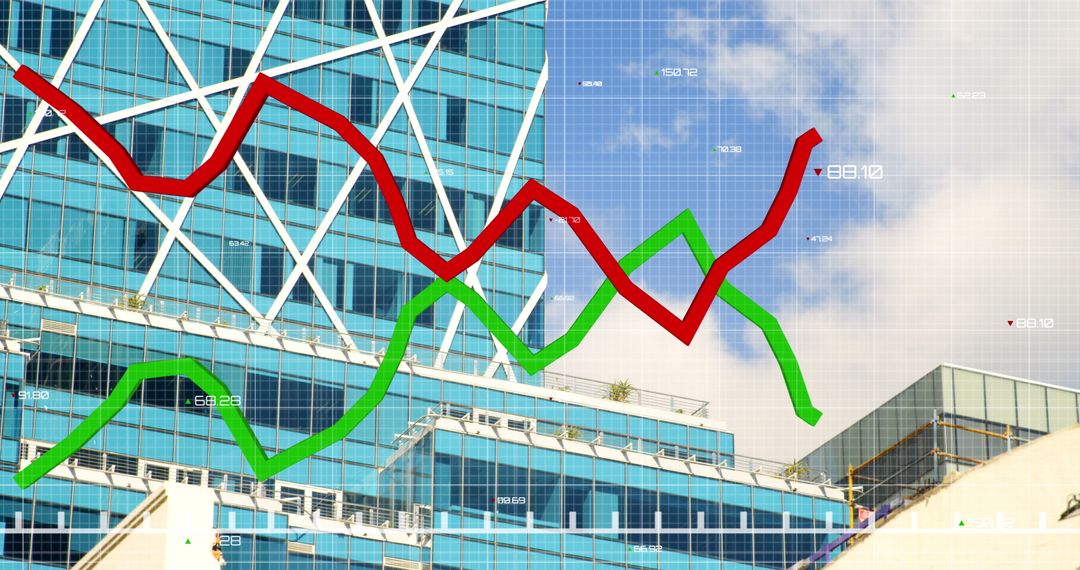
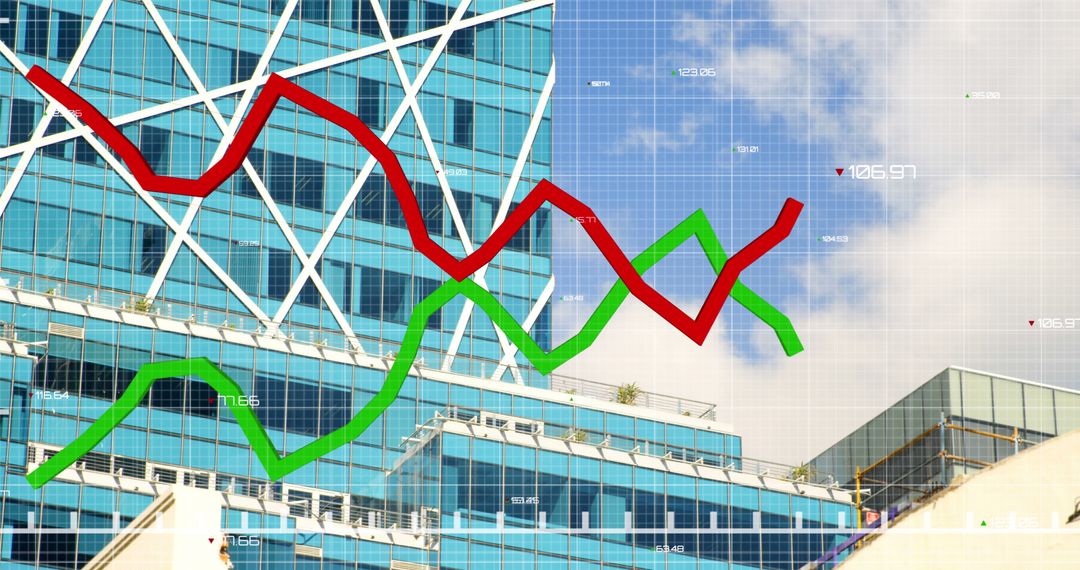
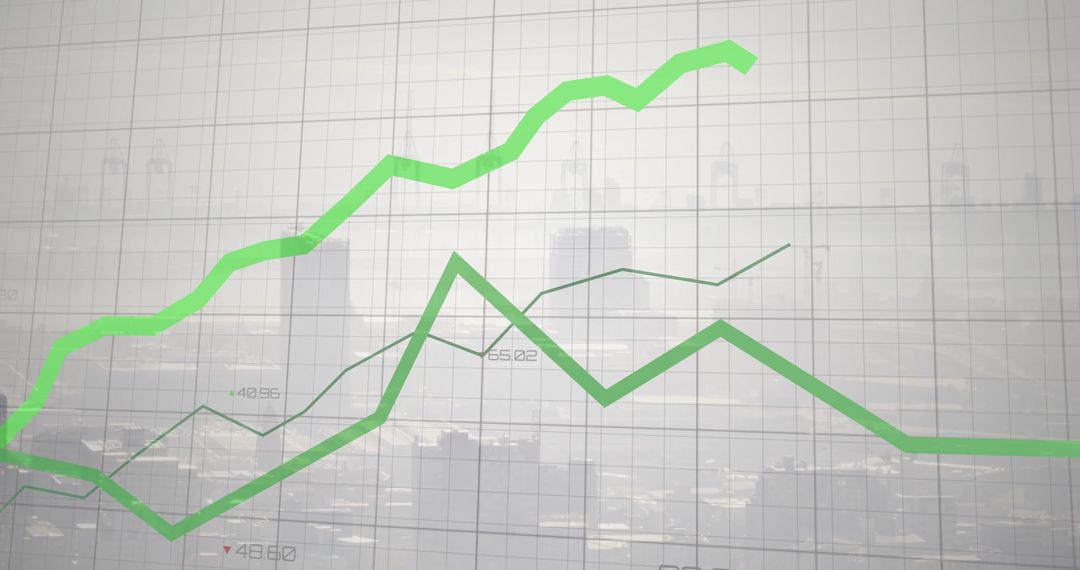
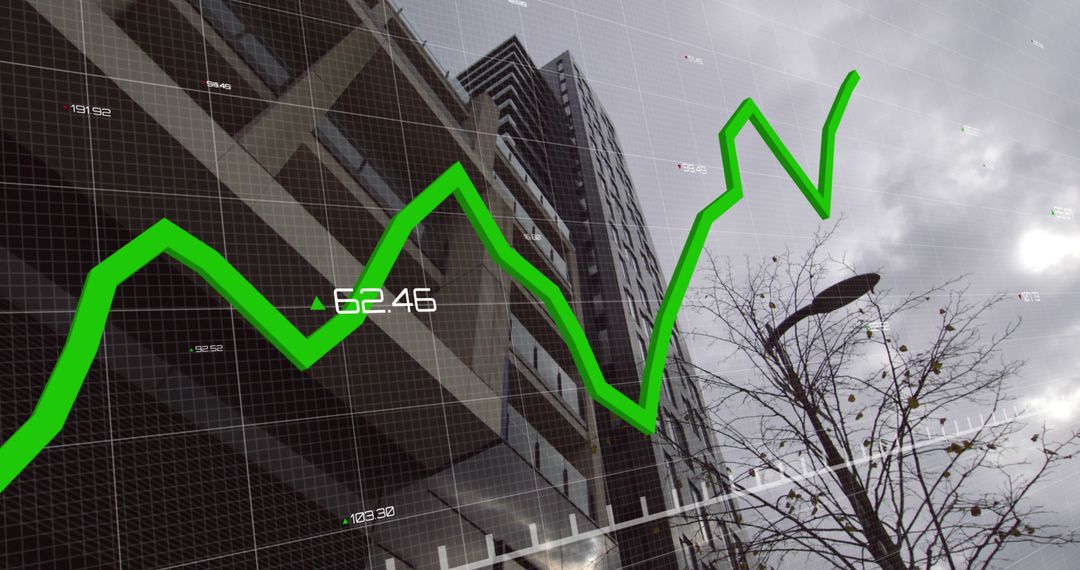
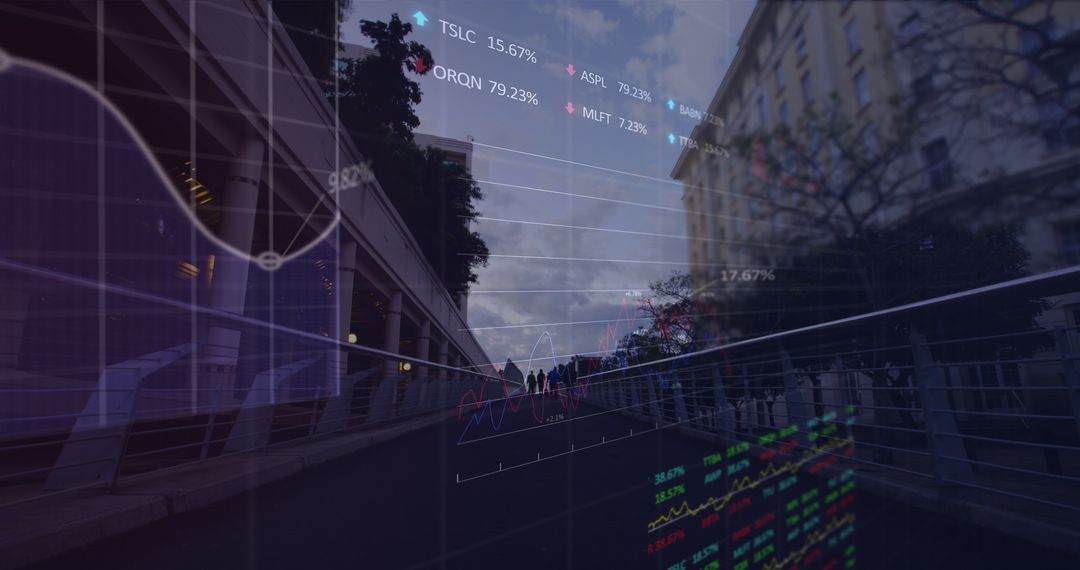
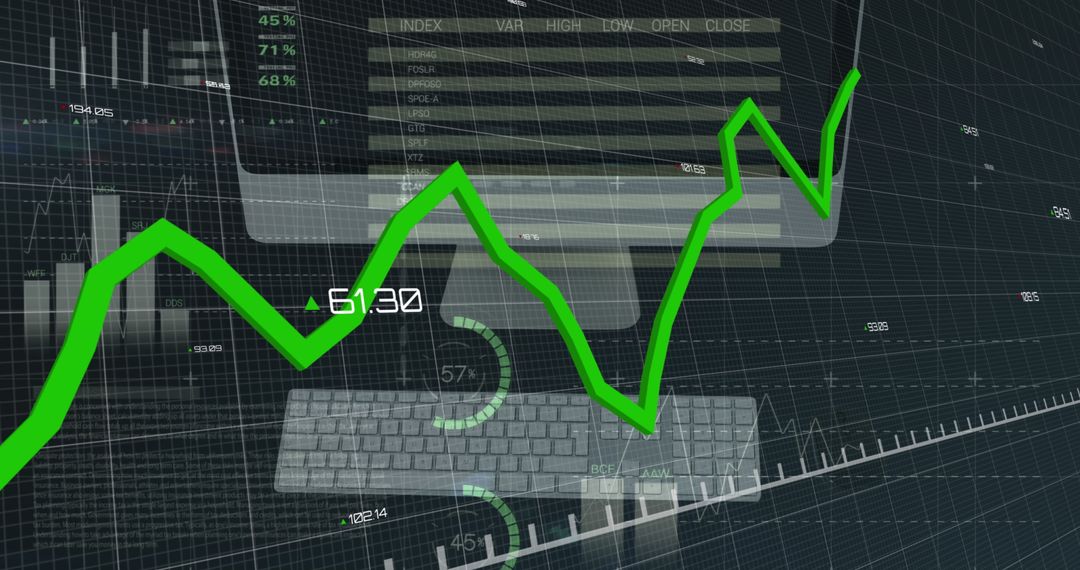
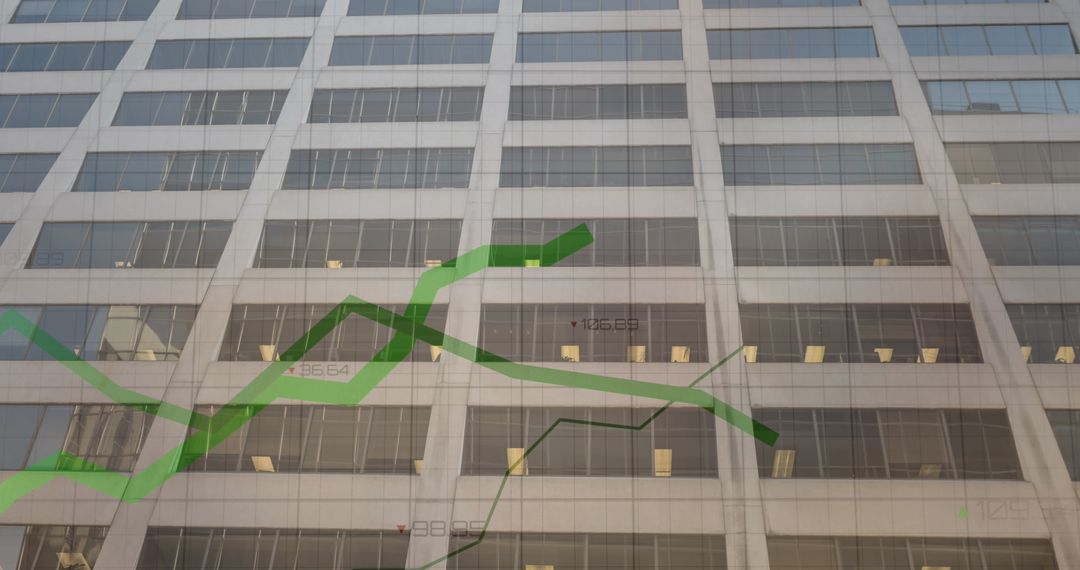
- Financial Data Analysis Concept with Modern Building Background
Financial Data Analysis Concept with Modern Building Background Image
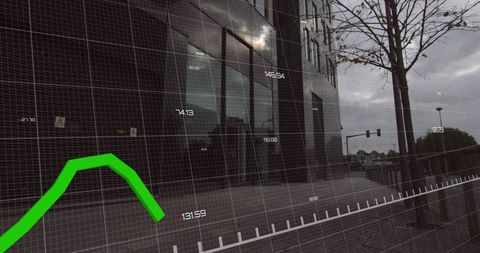
Conceptual image represents financial data analysis superimposed on urban setting. Green lines indicate trends in business, finance, and global economic analysis. Ideal for financial news, stock market updates, global business articles, technology and finance visuals.
Powered by 


2
downloads
downloads
Tags:
More
Credit Photo
If you would like to credit the Photo, here are some ways you can do so
Text Link
photo Link
<span class="text-link">
<span>
<a target="_blank" href=https://pikwizard.com/photo/financial-data-analysis-concept-with-modern-building-background/199bf09b07fc4de7f14e9c29ce56a258/>PikWizard</a>
</span>
</span>
<span class="image-link">
<span
style="margin: 0 0 20px 0; display: inline-block; vertical-align: middle; width: 100%;"
>
<a
target="_blank"
href="https://pikwizard.com/photo/financial-data-analysis-concept-with-modern-building-background/199bf09b07fc4de7f14e9c29ce56a258/"
style="text-decoration: none; font-size: 10px; margin: 0;"
>
<img src="https://pikwizard.com/pw/medium/199bf09b07fc4de7f14e9c29ce56a258.jpg" style="margin: 0; width: 100%;" alt="" />
<p style="font-size: 12px; margin: 0;">PikWizard</p>
</a>
</span>
</span>
Free (free of charge)
Free for personal and commercial use.
Author: Awesome Content
Similar Free Stock Images

Premium


Premium


Premium


Premium


Premium


Premium


Premium


Premium


Premium


Premium


Premium


Premium


Premium


Premium


Premium


Premium


Premium


Premium


Premium


Premium


Premium


Premium


Premium


Premium