- Home >
- Stock Photos >
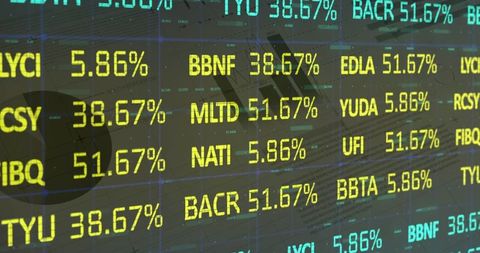
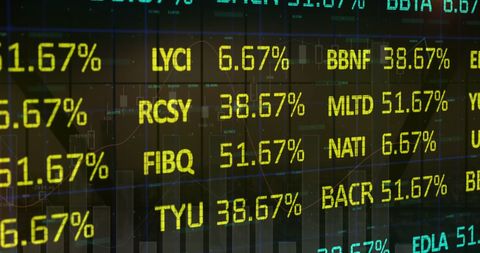
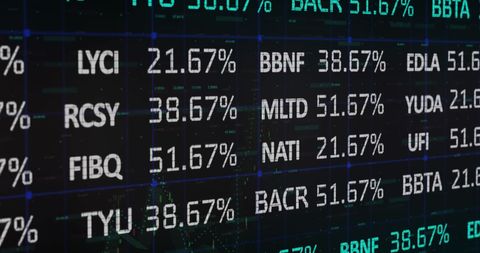
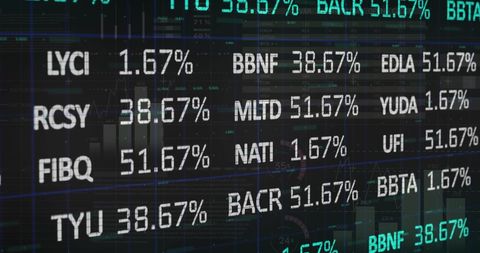
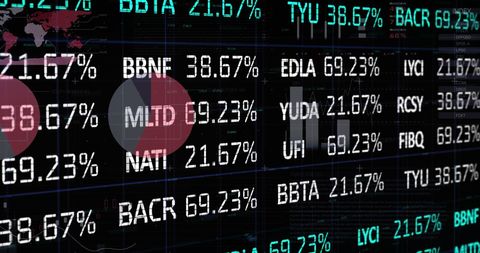
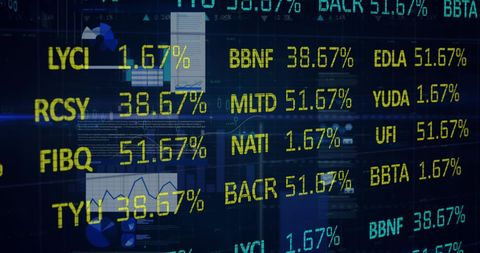
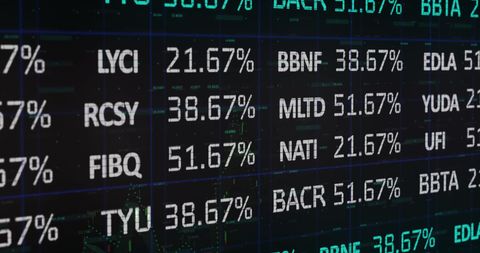
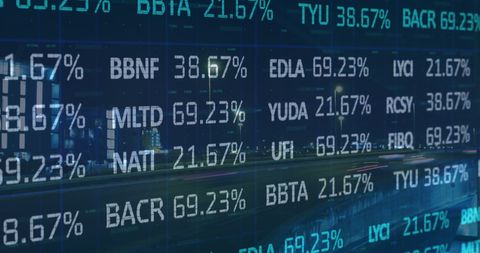
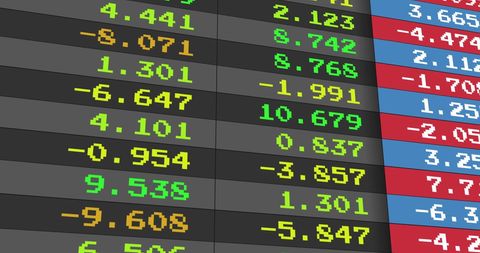
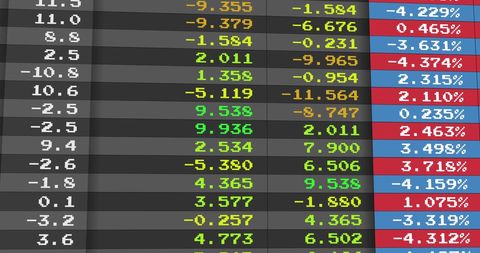
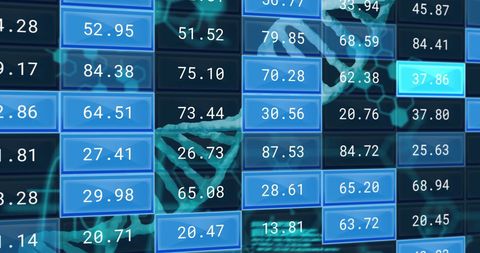
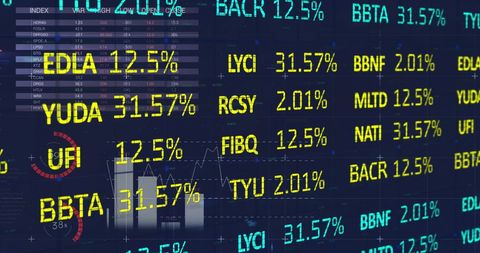
- Financial Data Analysis on Digital Screen with Stocks Graphs
Financial Data Analysis on Digital Screen with Stocks Graphs Image
Financial data analysis displayed on digital screens with various stocks and percentages, representing the dynamics of investment markets. Different sectors such as technology, banking, and automobiles are shown with growth statistics. Useful for financial reports, presentations about digital finance, and resources focused on investment strategies and economic trends.
Powered by  - Get 15% off with code: PIKWIZARD15


2
downloads
downloads
Tags:
More
Credit Photo
If you would like to credit the Photo, here are some ways you can do so
Text Link
photo Link
<span class="text-link">
<span>
<a target="_blank" href=https://pikwizard.com/photo/financial-data-analysis-on-digital-screen-with-stocks-graphs/84d45e65eb21fdb15579c6562b6572b5/>PikWizard</a>
</span>
</span>
<span class="image-link">
<span
style="margin: 0 0 20px 0; display: inline-block; vertical-align: middle; width: 100%;"
>
<a
target="_blank"
href="https://pikwizard.com/photo/financial-data-analysis-on-digital-screen-with-stocks-graphs/84d45e65eb21fdb15579c6562b6572b5/"
style="text-decoration: none; font-size: 10px; margin: 0;"
>
<img src="https://pikwizard.com/pw/medium/84d45e65eb21fdb15579c6562b6572b5.jpg" style="margin: 0; width: 100%;" alt="" />
<p style="font-size: 12px; margin: 0;">PikWizard</p>
</a>
</span>
</span>
Free (free of charge)
Free for personal and commercial use.
Author: Authentic Images
Similar Free Stock Images

Premium


Premium


Premium


Premium


Premium


Premium


Premium


Premium


Premium


Premium


Premium


Premium


Premium


Premium


Premium


Premium


Premium


Premium


Premium


Premium


Premium


Premium


Premium


Premium


Premium