- Home >
- Stock Photos >
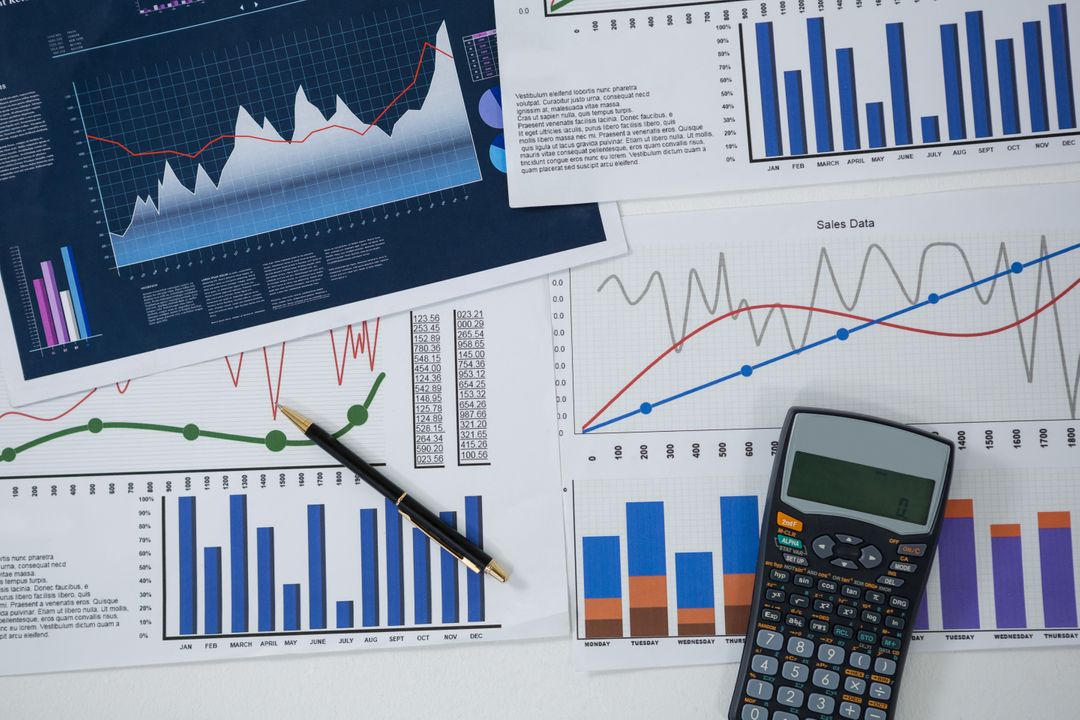
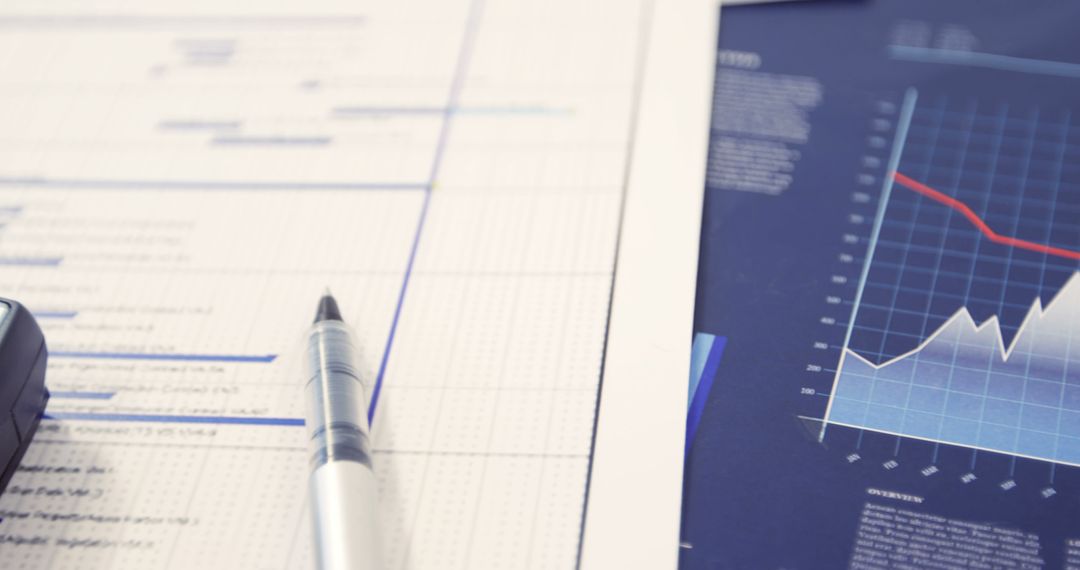
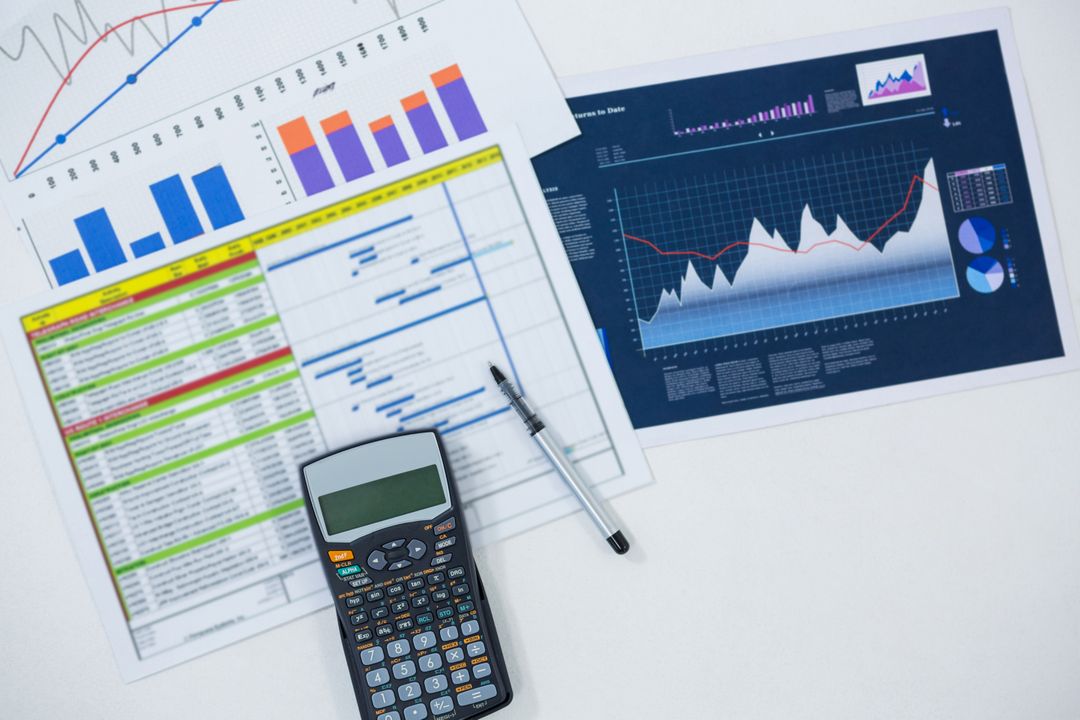
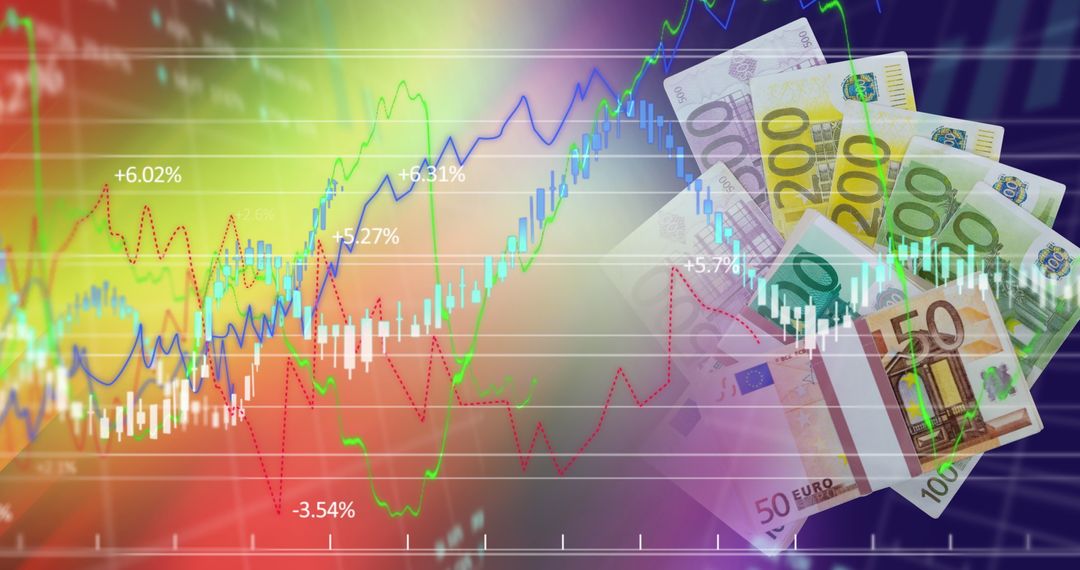
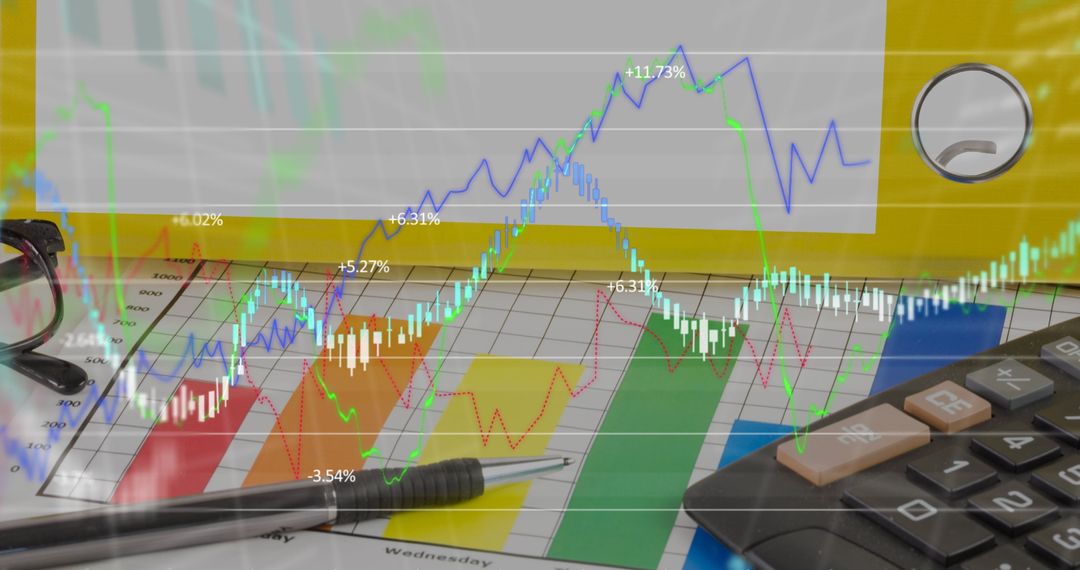
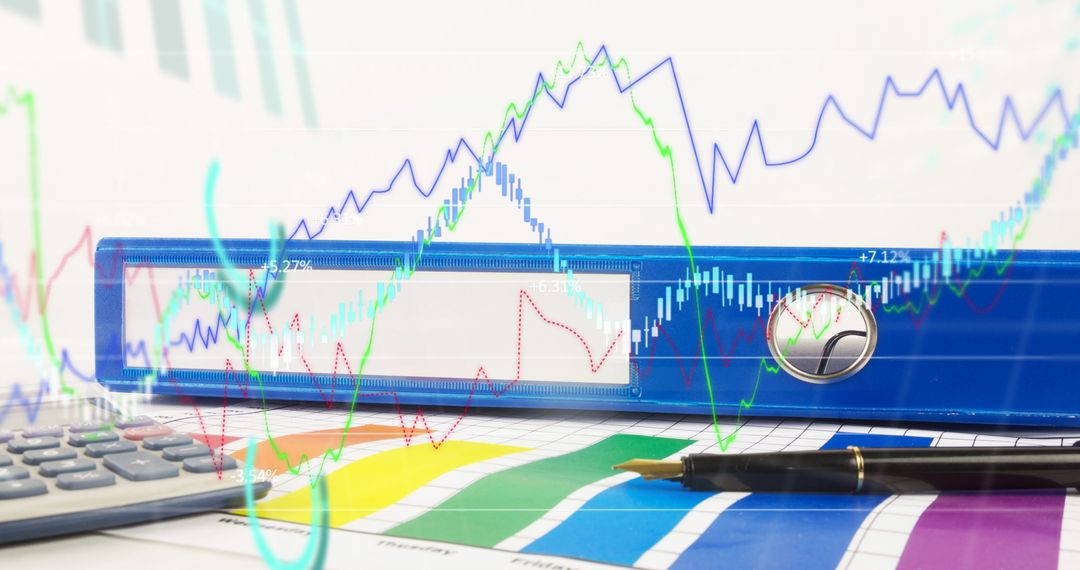
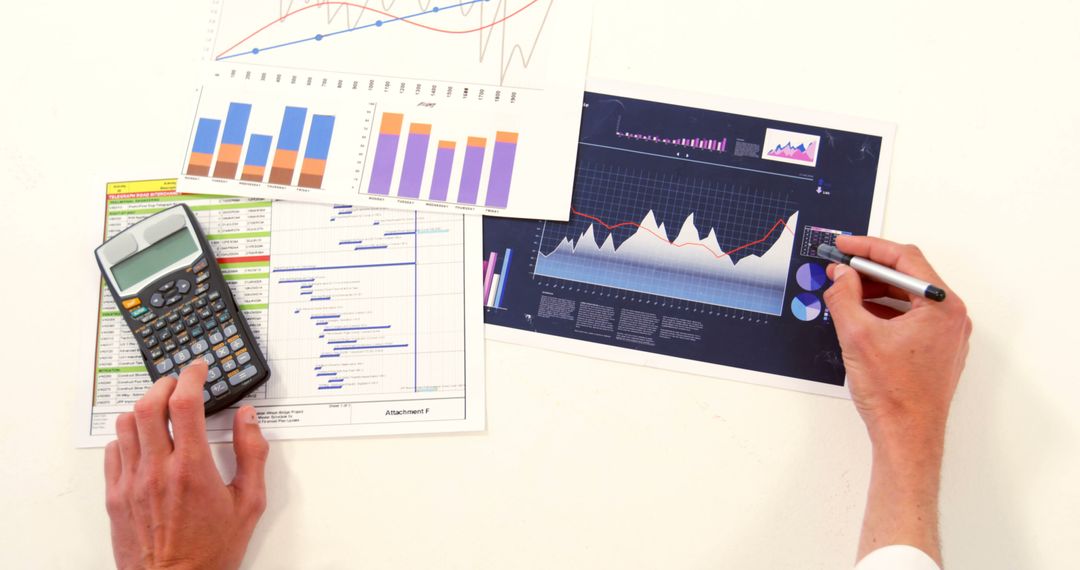
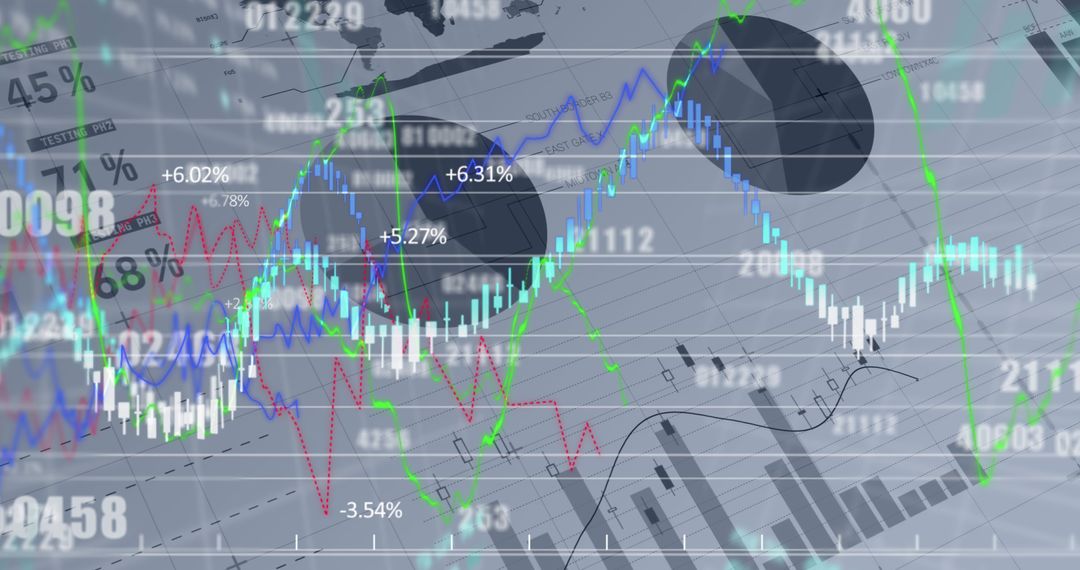
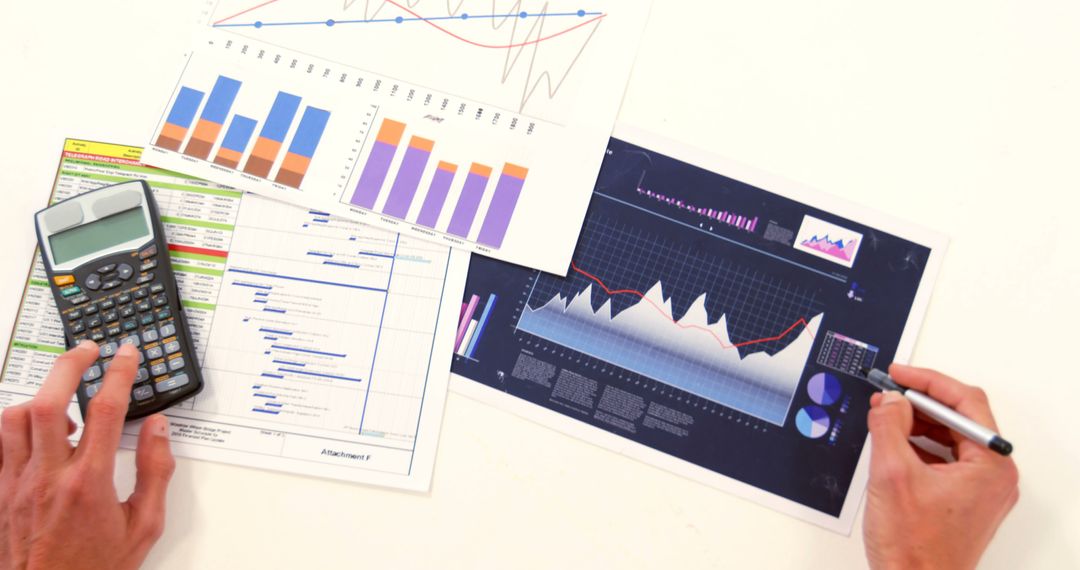
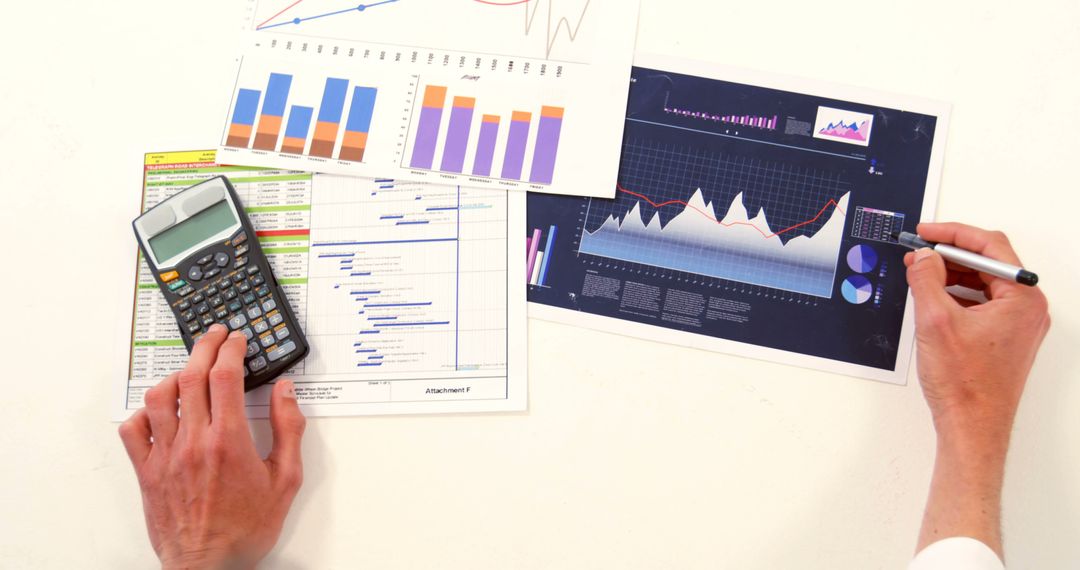
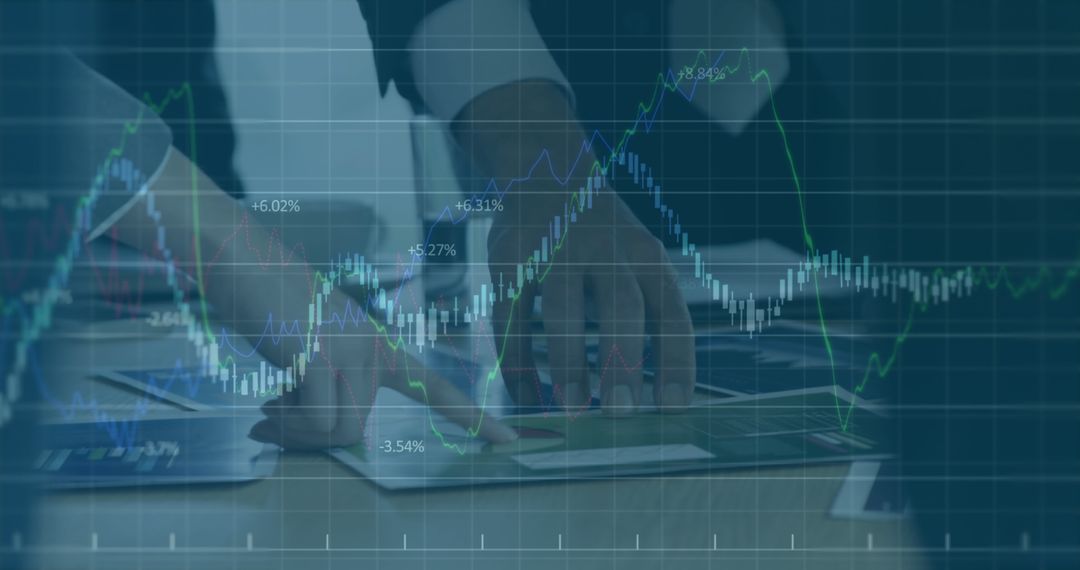
- Financial Data Analysis with Charts and Calculator on Desk
Financial Data Analysis with Charts and Calculator on Desk Image
Busy desk depicts financial analysis scene with colorful charts, calculator, and global finance concept. Ideal for illustrating concepts of business strategy, financial planning, economic forecasts, and digital finance solutions.
Powered by  - Get 15% off with code: PIKWIZARD15


0
downloads
downloads
Tags:
More
Credit Photo
If you would like to credit the Photo, here are some ways you can do so
Text Link
photo Link
<span class="text-link">
<span>
<a target="_blank" href=https://pikwizard.com/photo/financial-data-analysis-with-charts-and-calculator-on-desk/b6025f2e66222f83461593641088d95a/>PikWizard</a>
</span>
</span>
<span class="image-link">
<span
style="margin: 0 0 20px 0; display: inline-block; vertical-align: middle; width: 100%;"
>
<a
target="_blank"
href="https://pikwizard.com/photo/financial-data-analysis-with-charts-and-calculator-on-desk/b6025f2e66222f83461593641088d95a/"
style="text-decoration: none; font-size: 10px; margin: 0;"
>
<img src="https://pikwizard.com/pw/medium/b6025f2e66222f83461593641088d95a.jpg" style="margin: 0; width: 100%;" alt="" />
<p style="font-size: 12px; margin: 0;">PikWizard</p>
</a>
</span>
</span>
Free (free of charge)
Free for personal and commercial use.
Author: Authentic Images
Similar Free Stock Images
Premium


Premium


Premium


Premium


Premium


Premium


Premium


Premium


Premium


Premium


Premium


Premium


Premium


Premium

Premium


Premium


Premium


Premium


Premium


Premium


Premium


Premium


Premium


Premium