1. Home > 
  2. Stock Photos > 
  3. Financial Data Analysis with Coins in Background Highlighting Growth

Financial Data Analysis with Coins in Background Highlighting Growth Image

Financial Data Analysis with Coins in Background Highlighting Growth

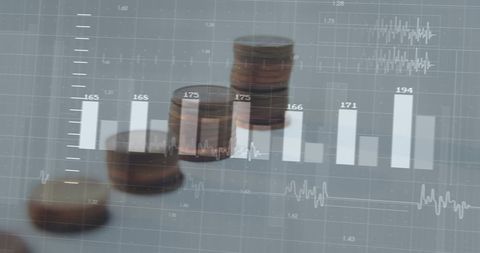
Visualizes interplay between tangible currency and abstract data analysis, useful for illustrating investment opportunities, economic reports, business strategies, or educational purposes in finance related presentations or articles.

Powered by Shutterstock logo - Get 15% off with code: PIKWIZARD15
Stock market or forex trading graph and candlestick chart suitable for financial investment concept. Economy trends background for business idea and all art work design - Powered by Shutterstock - Get 15% off with code: PIKWIZARD15Stock market business finance, world economic growth trend, coin stack in background, investing mutual funds, financial risk management, debt ceiling, Quantitative Easing, effect inflation, interest - Powered by Shutterstock - Get 15% off with code: PIKWIZARD15Business finance and investment, Analyze economic growth charts for informed business finance decisions and financial decision-making. Stock Market report, Strategy, Data Collection, Forecasting - Powered by Shutterstock - Get 15% off with code: PIKWIZARD15Business finance and investment, Analyze economic growth charts for informed business finance decisions and financial decision-making. Stock Market report, Strategy, Data Collection, Forecasting - Powered by Shutterstock - Get 15% off with code: PIKWIZARD15Stacking green finance opportunities can lead to economic growth with money and coins representing the benefits of this sustainable concept. finance, green, money, coin, growth, stack, opportunity. - Powered by Shutterstock - Get 15% off with code: PIKWIZARD15

Credit Photo

If you would like to credit the Photo, here are some ways you can do so

Free (free of charge)

Free for personal and commercial use.

Author: People Creations

Similar Free Stock Images

Stacked Gold Coins Rising Bar Chart Illustration
Premium
Business finance and investment concept, Capital gain world money economic growth. coin stack financial graph chart, market report on cash currency concept.
Analyzing Financial Data with Graphs and Charts
Dynamic Digital Data Analysis on Elevated Grid
Financial Data Visualization in Modern Digital Display Office
Biotechnology Innovation Digital Overlay in Modern Laboratory
Premium
Stack of money coin with trading graph, financial investment concept use for background
Homemade Chemistry Experiment with Lab Equipment
Abstract Financial Charts with Graphs and Data Visualization
Petri Plates with Bacterial Cells on Laboratory Table
Scientist Using Test Tubes with Molecular Graphics in Laboratory
Premium
Serious business man trader analyst looking at computer monitor, investor broker analyzing indexes, financial chart trading online investment data on cryptocurrency stock market graph on pc screen.
Scientist Analyzing Data with Test Tubes in Lab
Global Network Connections with Statistical Data Overlays
Atom Illustrations Above Petri Dish in Laboratory Setting
Financial Analytics with Plant Growth Concept
Premium
Business finance and investment concept, Capital gain world money economic growth. coin stack financial graph chart, market report on cash currency concept.
Rising Graphs and Interactive Financial Data Analytics Background
Digital Analysis of Financial Data with Dynamic Graphs
Financial Growth Graph and Data Analytics Representation
Dynamic Lines Show Rising Financial Statistics Over Time
Premium
Graph of coins economics growth on wood cubes. Concept success in 2026 year. copy space.
Financial Data Processing with Digital Graph Overlay
Abstract Graphic Business Data Visualization
Abstract Financial Data Analysis and Stock Market Trends
Digital Data and Financial Charts on White Background
Premium
Price of electricity is rising considerably worldwide due to  global crisis. High energy prices in 2022.
Scientists Analyzing Data with Digital Interface Technology
Financial Data Visualization and Analysis Concept
Dynamic Financial Data Visualization with Binary Code Overlay
Female Scientist in Protective Gear Conducting Laboratory Experiment
Digital Graphs Displaying Financial Data Analysis in Blue
Abstract Financial Data Visualization with Floating Numbers
Premium
Businessman putting down money, pointing with pen and showing candlestick symbol for investing, finance, saving money, interest rate or dividend investment, business growth concept.
Digital Time-Lapse Overlays Financial Investment Strategy
Financial Data Charts with World Map on Blue Digital Background
Digital Data Processing Over Laboratory For Modern Medical Advancements
Green Line Rising on Digital Trading Board with Abstract Background
Premium
Finance, banking and investment, Asset allocation, budget management. Business woman calculating financial report, cost control and budgeting with business data graph growth chart. Tax and budgeting
Abstract Digital Chart in Futuristic Financial Analysis Concept
Young Student Holding Petri Dish in Scientific Experiment
Financial Data Statistics Visualized in Urban Setting
Digital Financial Interface with Cityscape Background
Premium
Man hand holding coin on wood table. Save money and financial investment and saving money for buying house, financial plan home loan concept.
Futuristic Scientific Data Processing with Laboratory Elements
Futuristic Laboratory Data Visualization with Petri Dishes
Financial Analytics Visualized with Clock and Coin Concept
Digital Financial Data Overlay on Urban Street Scene
Premium
Stock market or forex trading graph and candlestick chart suitable for financial investment concept. Economy trends background for business idea and all art work design. Abstract finance background
Financial Graphs Overlaying Industrial Junkyard
Digital Financial Data and Multicurrency Exchange Charts
Digital Visualization Financial Data Growth Progressive Graph
Digital Analytics and Cybersecurity on Blue Tech Background
Premium
Business finance and investment, Analyze economic growth charts for informed business finance decisions and financial decision-making. Stock Market report, Strategy, Data Collection, Forecasting
Dynamic Forex Market Chart with Multiple Currencies and Growth Trends
Dynamic Visualization of Financial Data and Analysis
Colorful Financial Data Analytics and Digital Graph
Pipette Filling Petri Dish with Molecular Structures Digital Overlay
Premium
Concept of green finance has become integral to business strategy, driving economic growth and ensuring financial success through sustainable investments in green economy. finance, business, green.
Financial Data Analysis with Growing Stock Trends
Dynamic Financial Data Analysis with Growth Indicators
Financial Data Analysis Graph on Blue Background Concept
Global Finance and Economics Abstract Concept with Coins and Graphs
Digital Financial Data and Rising Coin Stacks Visualization
Complex Financial Data Analysis on Purple Grid Background
Premium
Fund trading concept. Businessman planning long-term investments, buying DCA mutual funds, analyzing economic trends, stock market volatility, taking high investment risks. Fund management, coins.
Innovative Data Analysis in Scientific Research Laboratory
Digital Graph Interface on Global Technology Background
Financial Growth Chart Displaying Performance Trends
Scientist in Protective Gear Examining Petri Dish
Premium
coin stack finance investment economy, Economic growth inflation. saving money.business financial concept.
Young Scientist Experimenting with Glass and Equations Overlay
Chemical Equipment Integrated with Digital Data Interface
Dynamic Stock Market Graphs and Financial Data
Child Exploring Viral Biology with Petri Dish Experiment
Premium
Business finance and investment, world economic growth concept. Forex financial graph chart, market report on cash currency with copy space for business and finance background
Stacked Coins with Digital Financial Graph Interface
Scientist Conducting Experiment with Molecular Overlay in Laboratory
Financial Data and Graphs on Digital Blue Background
Futuristic Digital City with Data Overlay Background
Premium
Graph of coins economics growth on wood cubes. Concept success in 2026 year. copy space.
Dynamic Statistical Data Analysis with Gradient Colors
Biohazard Symbol and COVID-19 Cells Overlay on Medical Data
Business Professionals Analyzing Financial Data Graphs in Office
Financial Trends and Economic Crisis Concepts in Blue Tones
Premium
Financial investment concept. Stock market or forex trading graph and stock exchange, summary chart, economy trends background. Abstract finance background for business presentation.
Digital Financial Report Analysis Overlaid on Office Scene
Data Overlay on Laboratory Test Tubes
Graphical Representation of Financial Data Processing
Digital Financial Graphs and Business Analytics on Blue Backdrop
Premium
Stack of gold money coin with trading graph, financial investment concept can be use as background
Abstract Digital Interface with Data Bars on Gradient Background
Scientist Examining Plant in Petri Dish with Biotech Visualization
Abstract Financial Data and Numbers in Virtual Environment
Financial Growth with Stacked Coins and Graph Data Overlay
Financial Data Analysis with Coins and Plant Image Overlay
Abstract Financial Market Data Analysis Visualization
Premium
Business finance and investment concept, Capital gain world money economic growth. coin stack financial graph chart, market report on cash currency concept.
Digital Financial Stock Market Data with Abstract Overlay
Scientist with Pipette Conducting Laboratory Research
Abstract Financial Charts in Futuristic Design
Petri Dish with Clear Fluid in Laboratory Setting at Sunrise
Premium
Growing money,finance and investment. Seedling are growing with business arrow of growth.Young plants on coin stacks  increase. Concept of business growth,profit, development and success.
Financial Growth in Urban Economy with Digital Analytics
Futuristic Digital Data Flow with Glowing Data Streams
Stagflation Concept with Digital Graphs and Data Patterns
DNA Strands Overlay on Laboratory Dishes for Scientific Research
Premium
Business, finance and investment concept. Double exposure of business man using calculator, coins and the city with financial graph growth chart, stock market analysis, financial report
Scientific Research in Modern Laboratory with Floating Formulae
Financial Data Visualization with Line and Bar Graphs
Digital Bar Graph with Blue Data Visualization
Abstract Global Data Networking on World Map
Premium
Green finance is driving economic growth with investments in sustainable energy reflected in rising graphs across business and financial sectors. finance, economy, green, business, investment, graph.
Futuristic Keyboard Analytics Display with Digital Graphs and Numbers
Futuristic Financial Data Analysis with Rising White Line Graph
Female Scientist Analyzing Data with Digital Innovation
Abstract Data Visualization on Blue Background for Technology Concept
Premium
Stock market or forex trading graph and candlestick chart suitable for financial investment concept. Economy trends background for business idea and all art work design. Abstract finance background
Digital Data Overlaid on Laboratory Test Tubes for Science and Research
Financial Growth Chart with Digital Data Interface
Digital Financial Data Overlaid on City Lights Background
Digital Analytics Visualization with Bar and Line Graphs
Premium
Business man putting coins Business growth and investment chart, strategic planning to increase profits from doing business, long-term investment planning.
Futuristic Translucent Pods in Vaporous Abstract Space