- Home >
- Stock Photos >
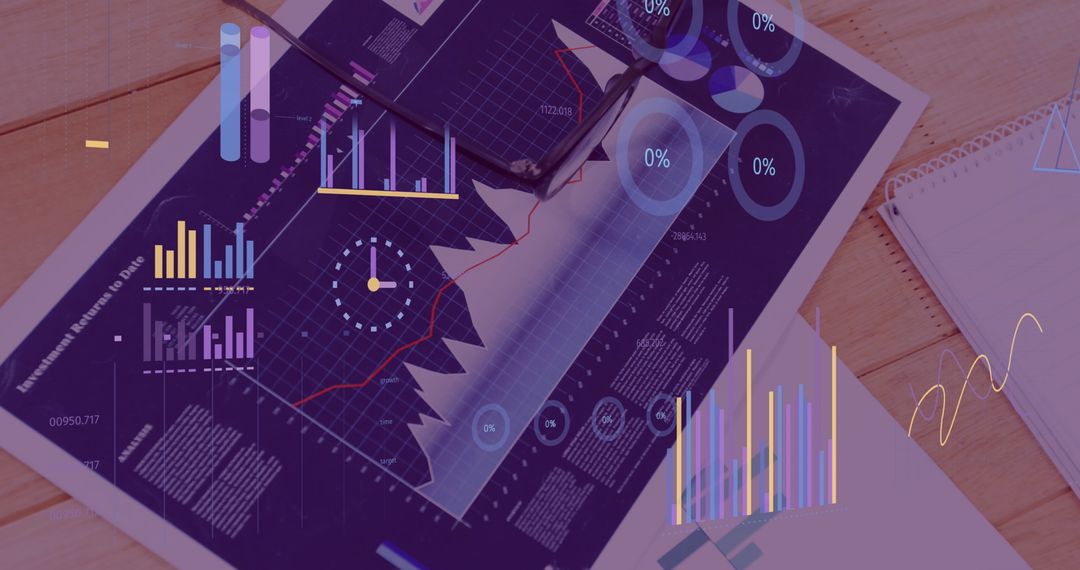
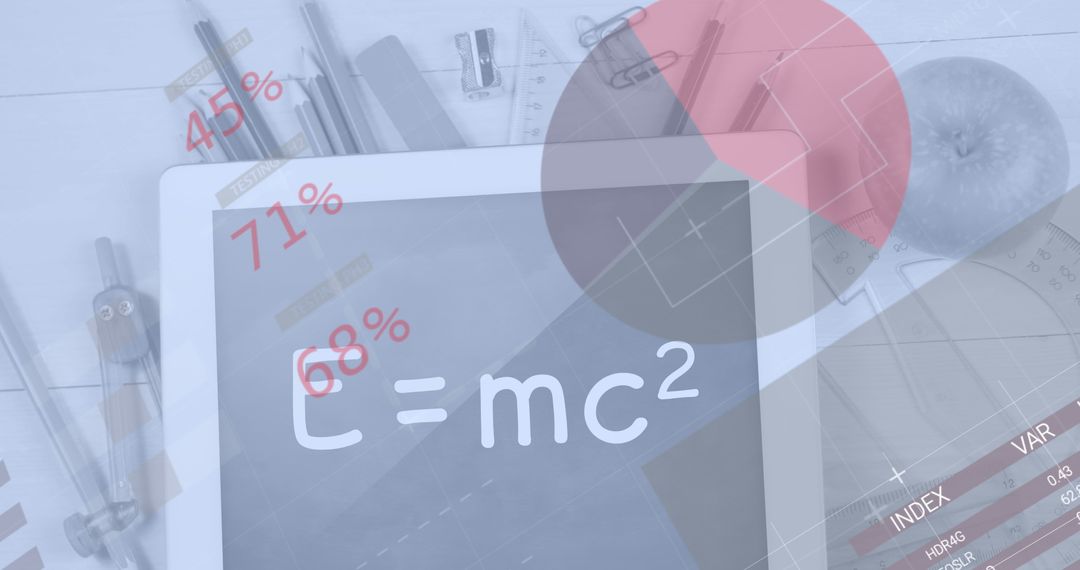
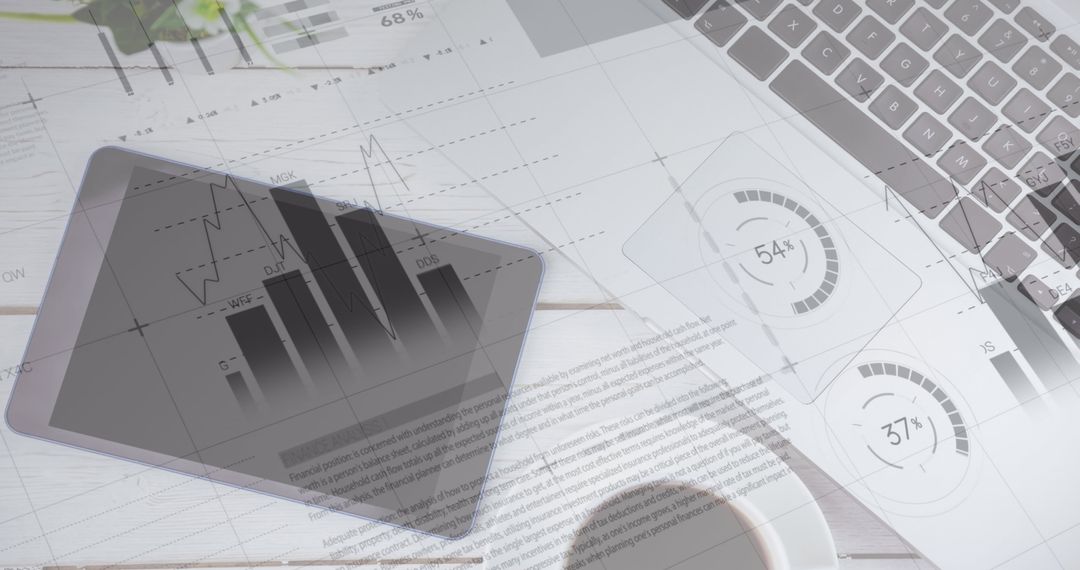
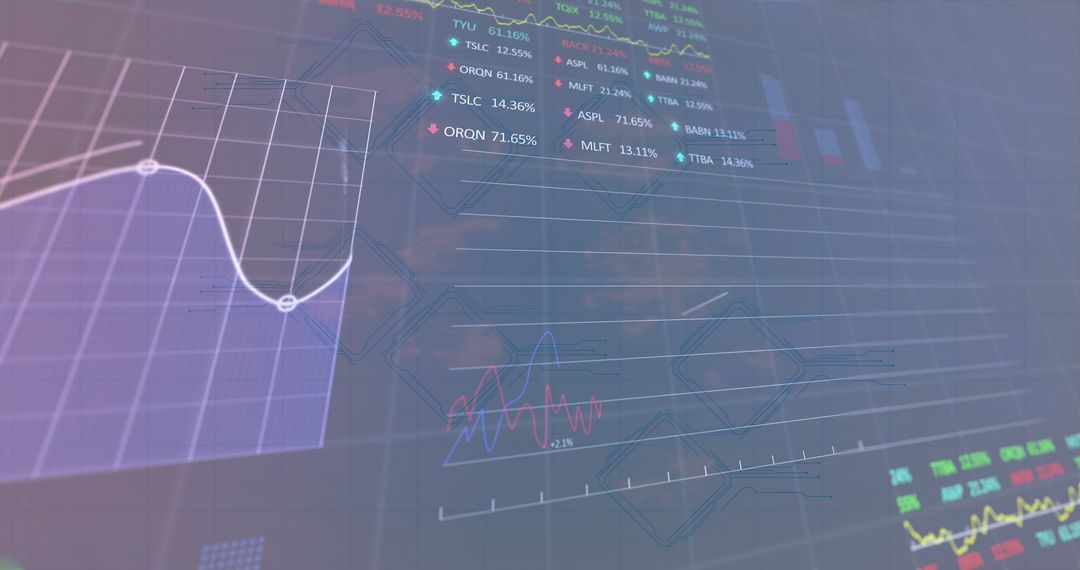
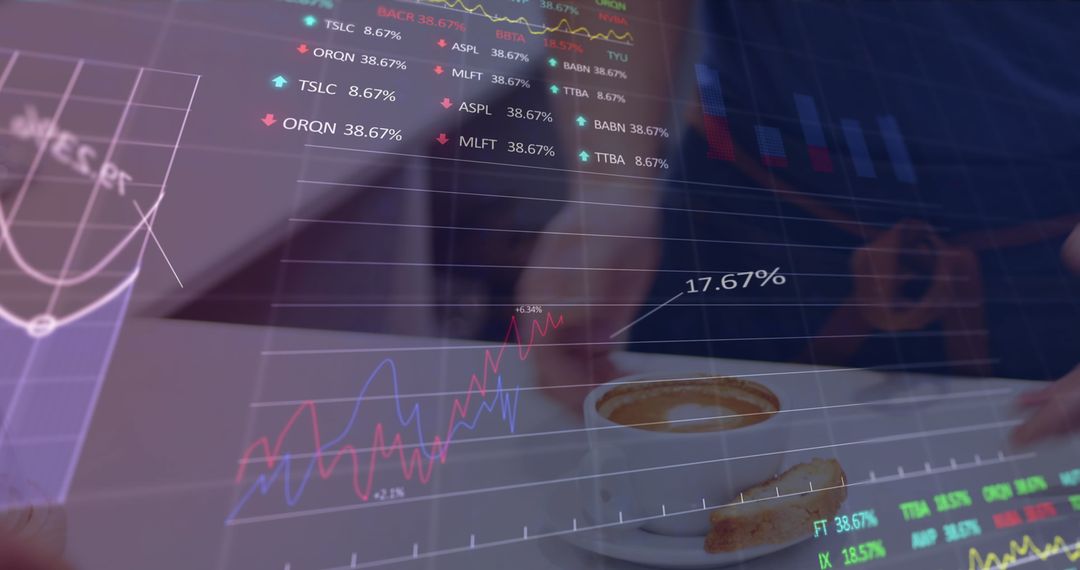
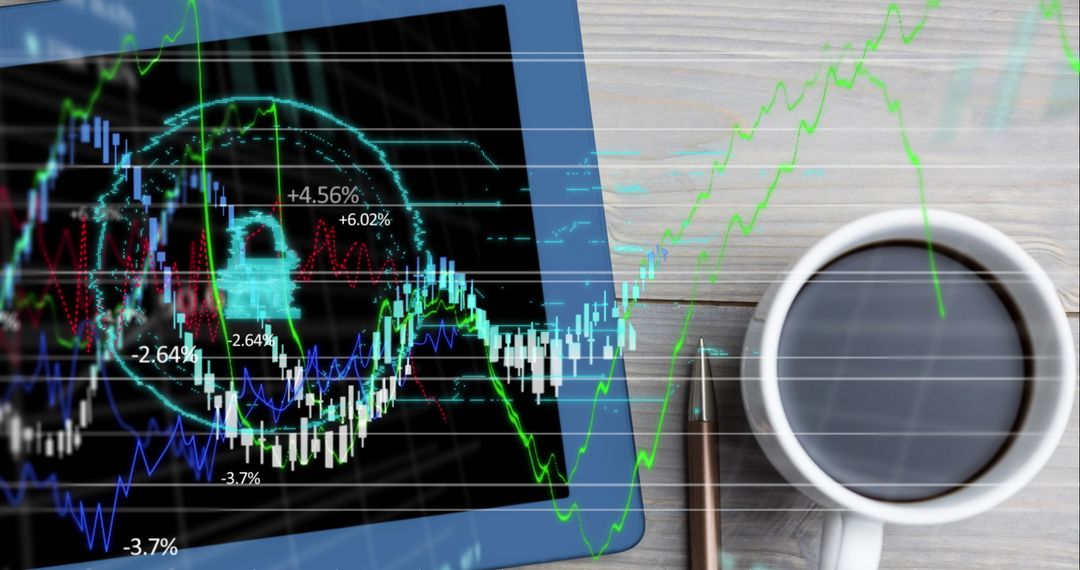
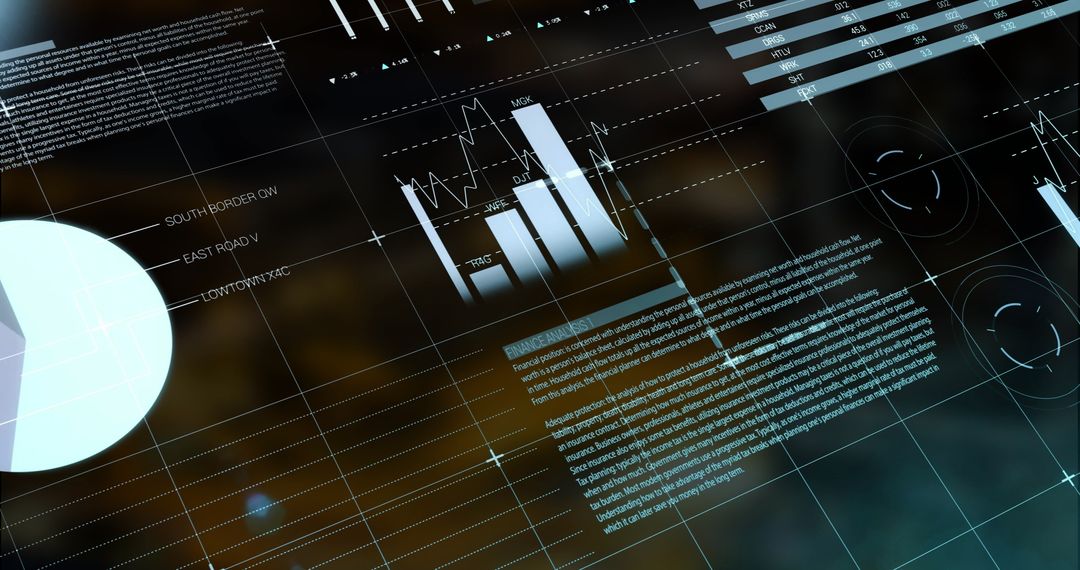
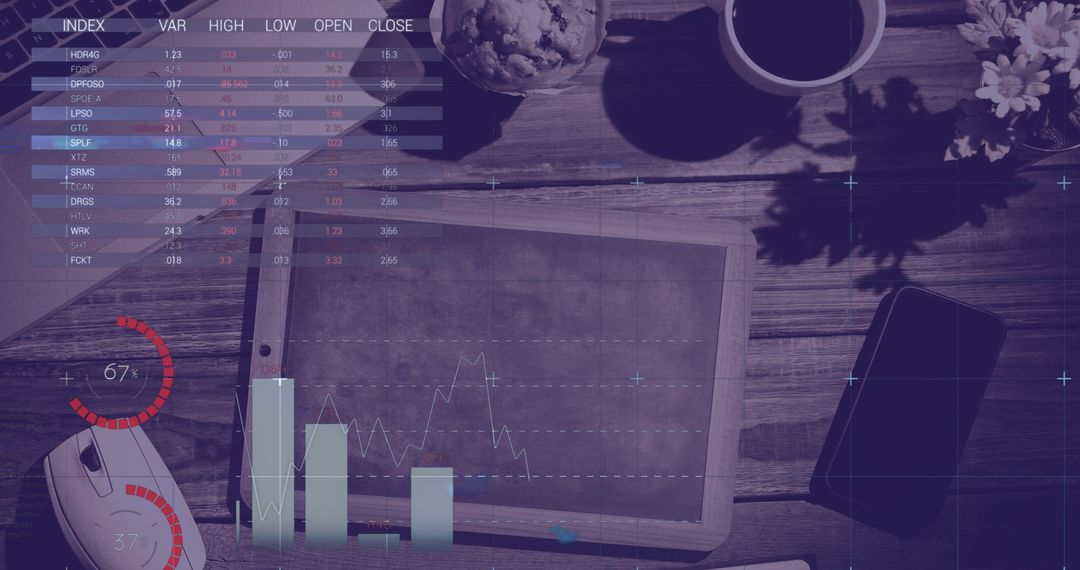
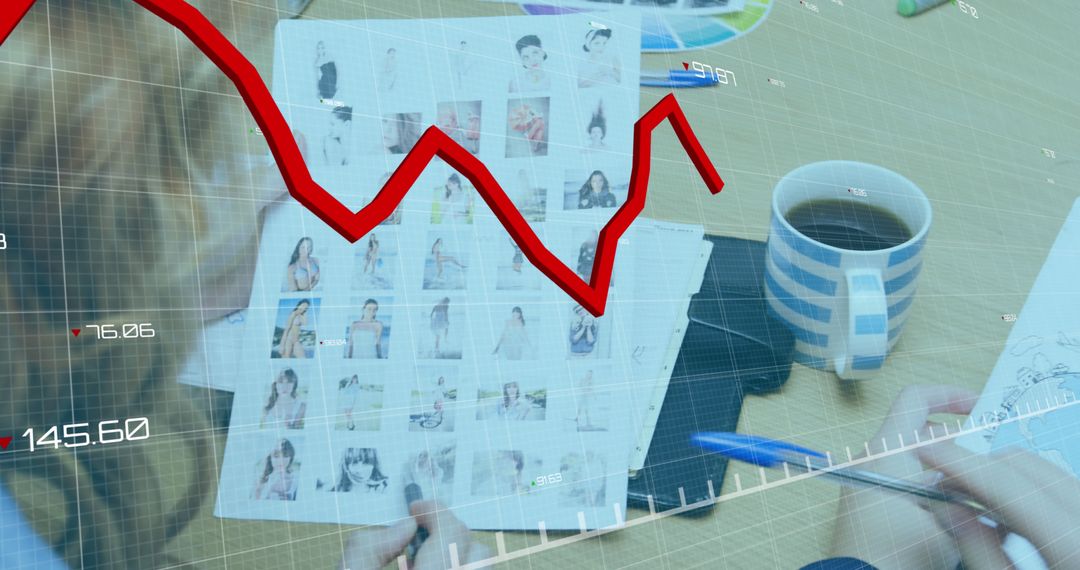
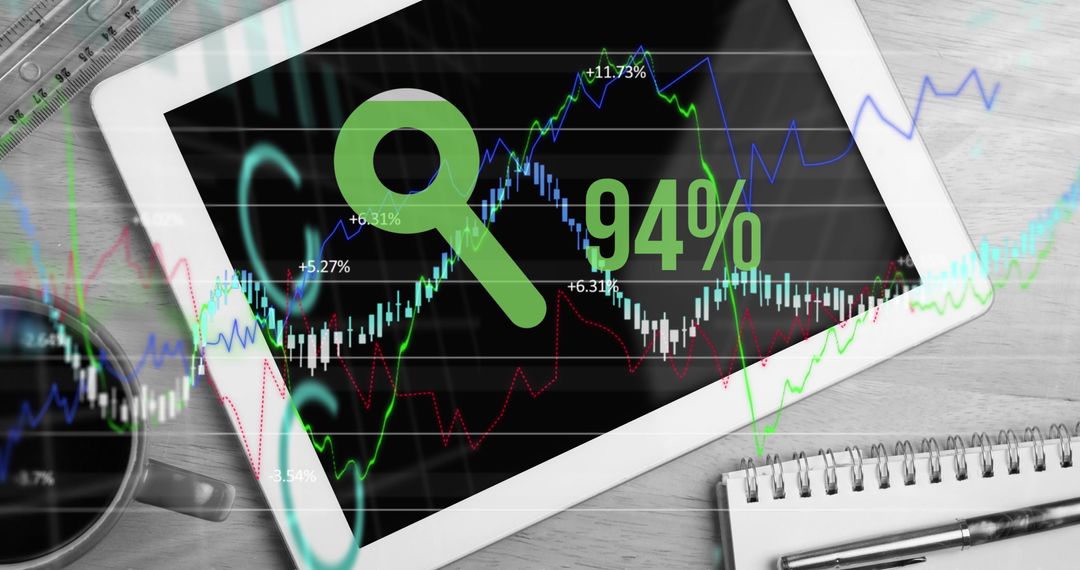
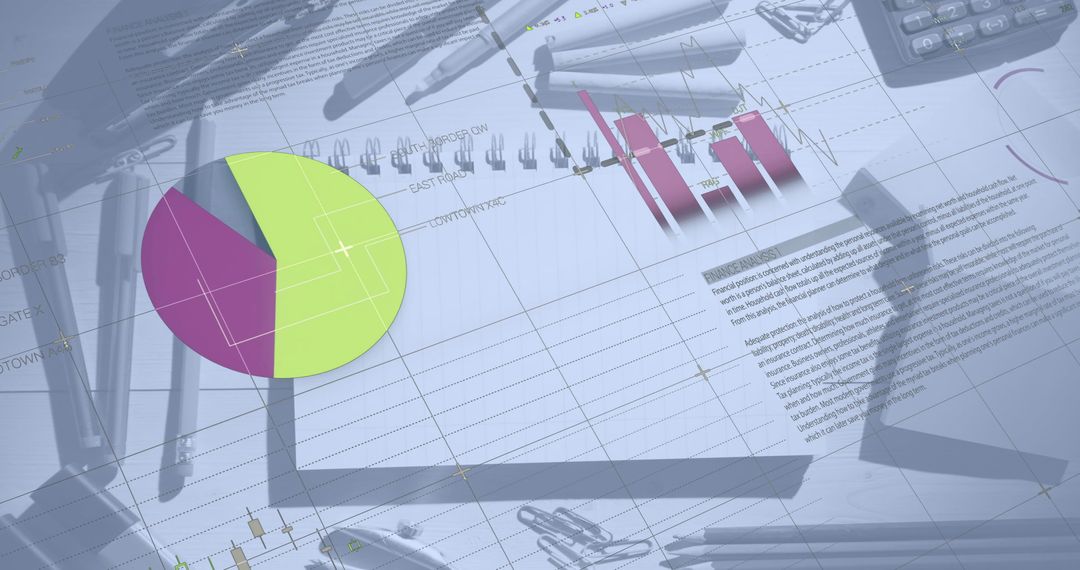
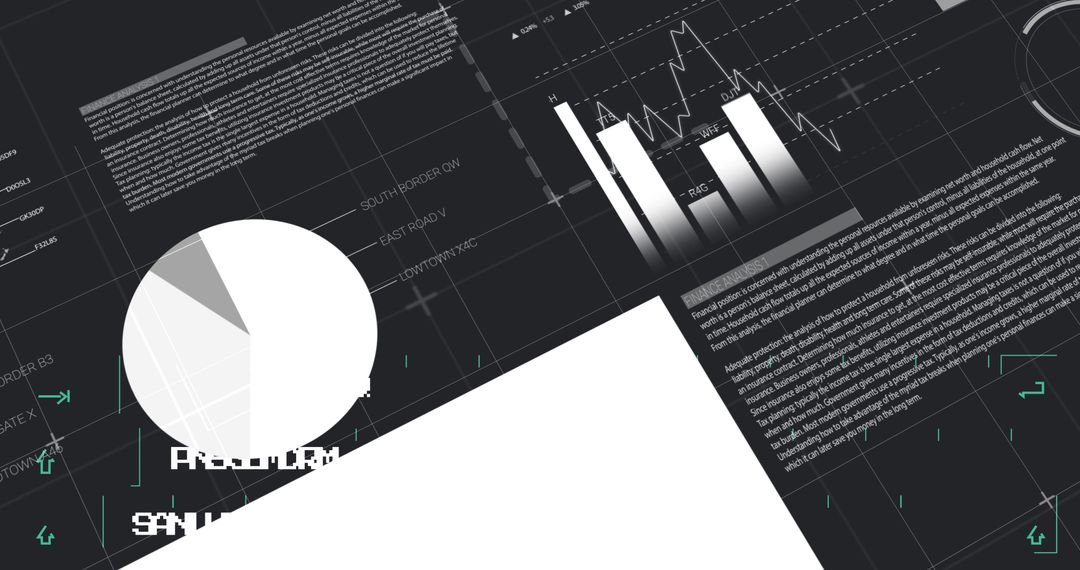
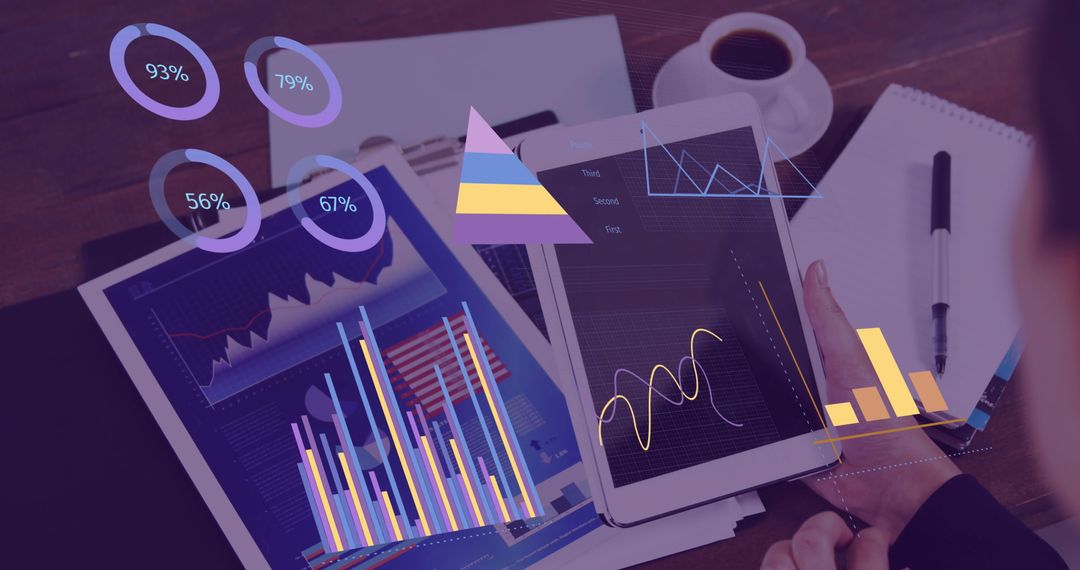
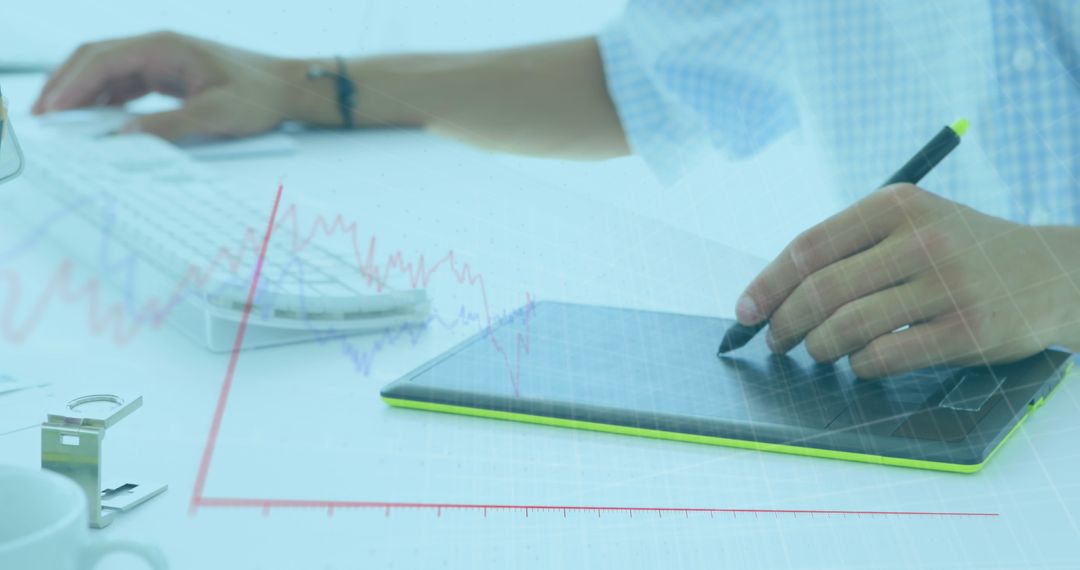
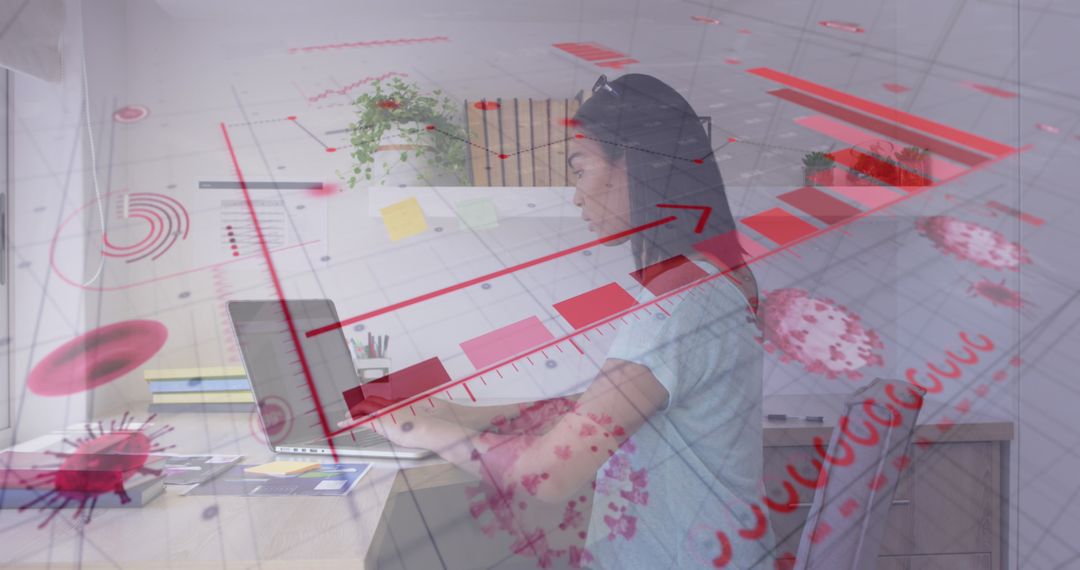
- Financial Data Analysis with Digital Tablet and Reports
Financial Data Analysis with Digital Tablet and Reports Image
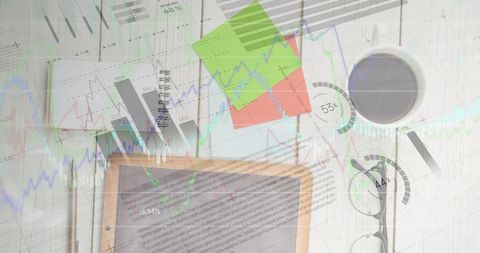
Digital tablet displaying financial data sits on desk alongside various graphs and paperwork, symbolically blending physical and digital business tools. It is useful for illustrating modern finance and analysis settings, business presentations, and articles about financial technology.
Powered by 


2
downloads
downloads
Tags:
More
Credit Photo
If you would like to credit the Photo, here are some ways you can do so
Text Link
photo Link
<span class="text-link">
<span>
<a target="_blank" href=https://pikwizard.com/photo/financial-data-analysis-with-digital-tablet-and-reports/6afba99724ce1d602f802f99d8226b6e/>PikWizard</a>
</span>
</span>
<span class="image-link">
<span
style="margin: 0 0 20px 0; display: inline-block; vertical-align: middle; width: 100%;"
>
<a
target="_blank"
href="https://pikwizard.com/photo/financial-data-analysis-with-digital-tablet-and-reports/6afba99724ce1d602f802f99d8226b6e/"
style="text-decoration: none; font-size: 10px; margin: 0;"
>
<img src="https://pikwizard.com/pw/medium/6afba99724ce1d602f802f99d8226b6e.jpg" style="margin: 0; width: 100%;" alt="" />
<p style="font-size: 12px; margin: 0;">PikWizard</p>
</a>
</span>
</span>
Free (free of charge)
Free for personal and commercial use.
Author: Awesome Content
Similar Free Stock Images
Premium


Premium

Premium


Premium


Premium


Premium


Premium


Premium


Premium


Premium


Premium


Premium


Premium


Premium


Premium


Premium


Premium


Premium


Premium


Premium


Premium


Premium


Premium


Premium