- Home >
- Stock Photos >
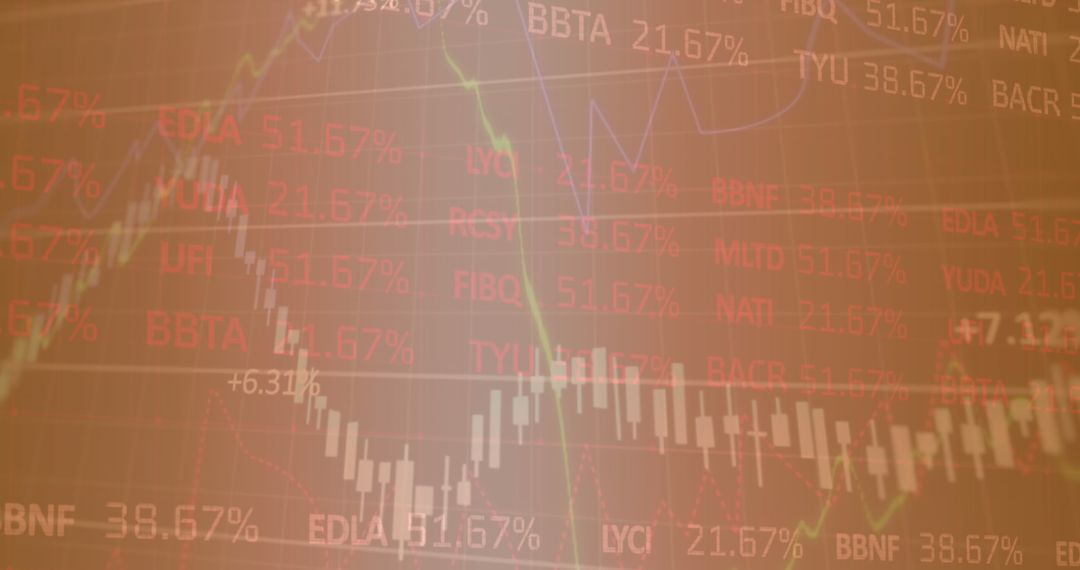
- Financial Data Analysis with Dynamic Growth Charts
Financial Data Analysis with Dynamic Growth Charts Image

This visual presents an engaging blend of numeric data and bar graphs in a digital interface, representing trends and market changes. Useful for illustrating articles on financial analysis, business forecasting, economic reports, and technological advances in data processing.
Powered by  - Get 15% off with code: PIKWIZARD15


2
downloads
downloads
Tags:
More
Credit Photo
If you would like to credit the Photo, here are some ways you can do so
Text Link
photo Link
<span class="text-link">
<span>
<a target="_blank" href=https://pikwizard.com/photo/financial-data-analysis-with-dynamic-growth-charts/01851cd31ed730f90dfe1c5c2947ebb8/>PikWizard</a>
</span>
</span>
<span class="image-link">
<span
style="margin: 0 0 20px 0; display: inline-block; vertical-align: middle; width: 100%;"
>
<a
target="_blank"
href="https://pikwizard.com/photo/financial-data-analysis-with-dynamic-growth-charts/01851cd31ed730f90dfe1c5c2947ebb8/"
style="text-decoration: none; font-size: 10px; margin: 0;"
>
<img src="https://pikwizard.com/pw/medium/01851cd31ed730f90dfe1c5c2947ebb8.jpg" style="margin: 0; width: 100%;" alt="" />
<p style="font-size: 12px; margin: 0;">PikWizard</p>
</a>
</span>
</span>
Free (free of charge)
Free for personal and commercial use.
Author: Awesome Content
Similar Free Stock Images

Premium


Premium


Premium


Premium


Premium


Premium


Premium


Premium


Premium


Premium


Premium


Premium


Premium


Premium


Premium


Premium


Premium


Premium


Premium


Premium


Premium


Premium


Premium


Premium