- Home >
- Stock Photos >
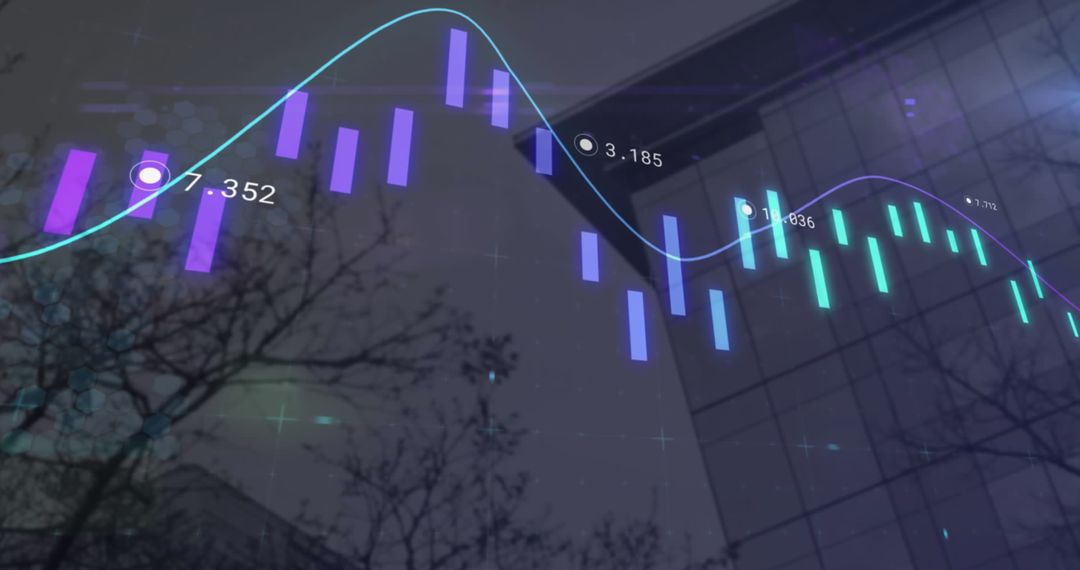
- Financial Data Analysis with Illuminated Cityscape Backdrop
Financial Data Analysis with Illuminated Cityscape Backdrop Image

Illuminated cityscape serves as backdrop for dynamic financial data visualization. Great for illustrating economic reports, financial technology presentations, and investment portfolio websites. Captures complexities and grandeur of urban business environment.
Powered by  - Get 15% off with code: PIKWIZARD15


0
downloads
downloads
Tags:
More
Credit Photo
If you would like to credit the Photo, here are some ways you can do so
Text Link
photo Link
<span class="text-link">
<span>
<a target="_blank" href=https://pikwizard.com/photo/financial-data-analysis-with-illuminated-cityscape-backdrop/72c072e5db8d6b9c71300cdd7240284a/>PikWizard</a>
</span>
</span>
<span class="image-link">
<span
style="margin: 0 0 20px 0; display: inline-block; vertical-align: middle; width: 100%;"
>
<a
target="_blank"
href="https://pikwizard.com/photo/financial-data-analysis-with-illuminated-cityscape-backdrop/72c072e5db8d6b9c71300cdd7240284a/"
style="text-decoration: none; font-size: 10px; margin: 0;"
>
<img src="https://pikwizard.com/pw/medium/72c072e5db8d6b9c71300cdd7240284a.jpg" style="margin: 0; width: 100%;" alt="" />
<p style="font-size: 12px; margin: 0;">PikWizard</p>
</a>
</span>
</span>
Free (free of charge)
Free for personal and commercial use.
Author: People Creations
Similar Free Stock Images

Premium


Premium


Premium


Premium


Premium


Premium


Premium


Premium


Premium


Premium


Premium


Premium


Premium


Premium


Premium


Premium


Premium


Premium


Premium


Premium


Premium


Premium


Premium


Premium