- Home >
- Stock Photos >
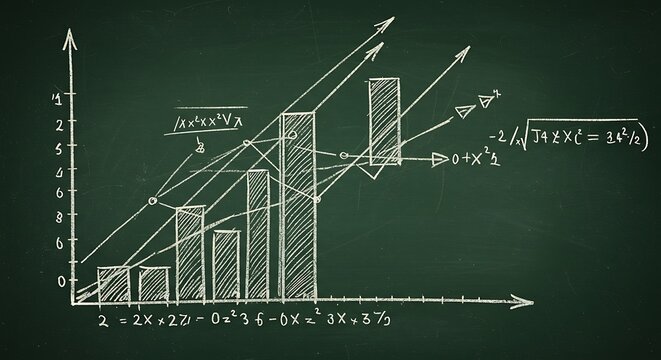
- Financial Data Analysis with Mathematical Equations Overlay
Financial Data Analysis with Mathematical Equations Overlay Image

Visual interpretation of financial data analysis with mathematical equations and equations in background. Perfect for uses relating to finance, global business strategy, data processing, or digital interfaces. Illustrates concepts of statistical growth and economic advancement.
Powered by 


2
downloads
downloads
Tags:
More
Credit Photo
If you would like to credit the Photo, here are some ways you can do so
Text Link
photo Link
<span class="text-link">
<span>
<a target="_blank" href=https://pikwizard.com/photo/financial-data-analysis-with-mathematical-equations-overlay/f757bdd5bb6d21023981011c57b57ac4/>PikWizard</a>
</span>
</span>
<span class="image-link">
<span
style="margin: 0 0 20px 0; display: inline-block; vertical-align: middle; width: 100%;"
>
<a
target="_blank"
href="https://pikwizard.com/photo/financial-data-analysis-with-mathematical-equations-overlay/f757bdd5bb6d21023981011c57b57ac4/"
style="text-decoration: none; font-size: 10px; margin: 0;"
>
<img src="https://pikwizard.com/pw/medium/f757bdd5bb6d21023981011c57b57ac4.jpg" style="margin: 0; width: 100%;" alt="" />
<p style="font-size: 12px; margin: 0;">PikWizard</p>
</a>
</span>
</span>
Free (free of charge)
Free for personal and commercial use.
Author: Creative Art
Similar Free Stock Images

Premium


Premium


Premium


Premium


Premium


Premium


Premium


Premium


Premium


Premium


Premium


Premium


Premium


Premium


Premium


Premium


Premium


Premium


Premium


Premium


Premium


Premium


Premium


Premium