
- Home >
- Stock Photos >
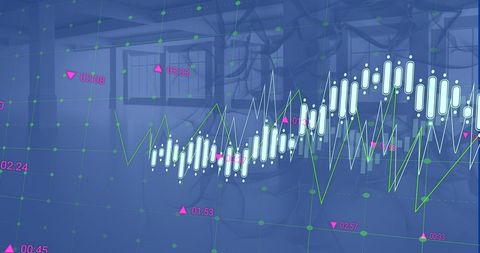
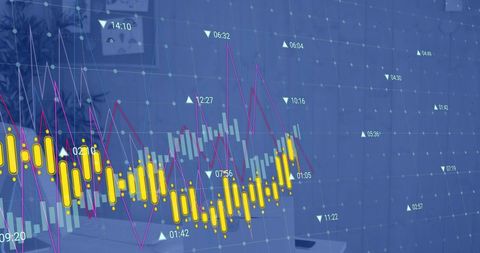
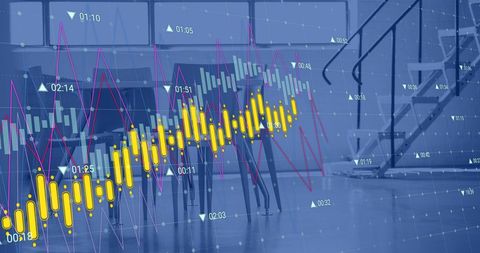
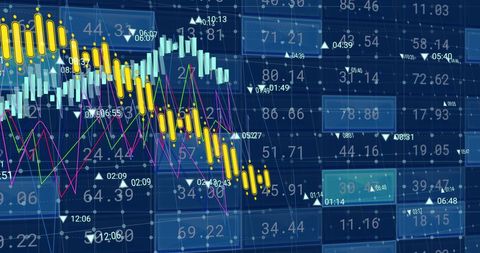
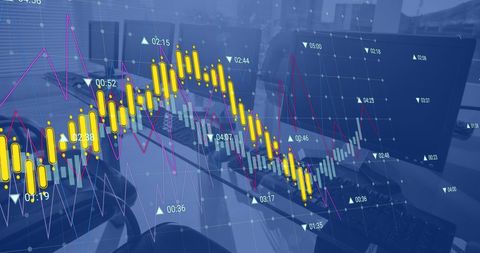
- Financial Data Analysis with Stock Market Graph Overlay
Financial Data Analysis with Stock Market Graph Overlay Image

Chart merging modern interfaces with trending global stock market design reflects complex data assessment processes utilized in finance. Ideal for illustrating stories in investment reports discussions on economic growth during seminars material making assets in fintech discussions website features articles conveying benches scholarly inquiries resources addressing investment contexts outcomes objectives connected stocks dynamic interactives patterns enhancements experience human interfaces linked equity demands quotes analytics editorial environments professional issuer equities relational trustee venues investmentÈ domain consultations jj
Powered by  - Get 15% off with code: PIKWIZARD15


2
downloads
downloads
Tags:
More
Credit Photo
If you would like to credit the Photo, here are some ways you can do so
Text Link
photo Link
<span class="text-link">
<span>
<a target="_blank" href=https://pikwizard.com/photo/financial-data-analysis-with-stock-market-graph-overlay/164ffa07ff6c3dd223657cdbe5776227/>PikWizard</a>
</span>
</span>
<span class="image-link">
<span
style="margin: 0 0 20px 0; display: inline-block; vertical-align: middle; width: 100%;"
>
<a
target="_blank"
href="https://pikwizard.com/photo/financial-data-analysis-with-stock-market-graph-overlay/164ffa07ff6c3dd223657cdbe5776227/"
style="text-decoration: none; font-size: 10px; margin: 0;"
>
<img src="https://pikwizard.com/pw/medium/164ffa07ff6c3dd223657cdbe5776227.jpg" style="margin: 0; width: 100%;" alt="" />
<p style="font-size: 12px; margin: 0;">PikWizard</p>
</a>
</span>
</span>
Free (free of charge)
Free for personal and commercial use.
Author: Authentic Images
Similar Free Stock Images

Premium


Premium


Premium


Premium


Premium


Premium


Premium


Premium


Premium


Premium


Premium


Premium


Premium


Premium


Premium


Premium


Premium


Premium


Premium


Premium


Premium


Premium


Premium


Premium


Premium

