- Home >
- Stock Photos >
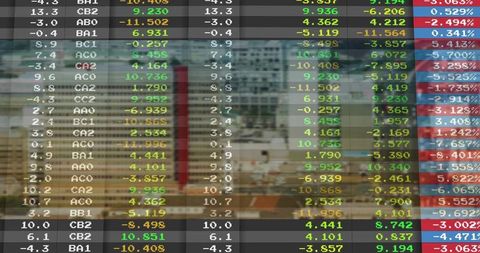
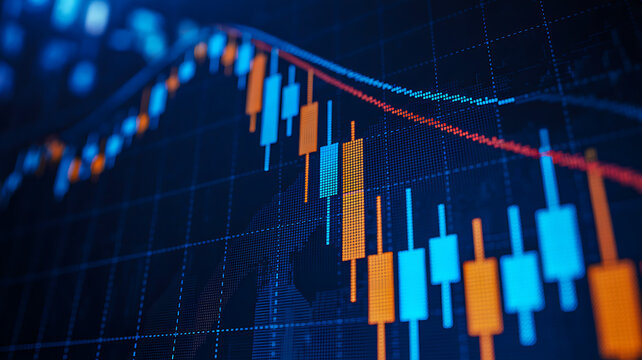
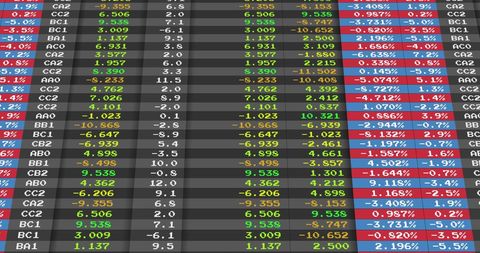
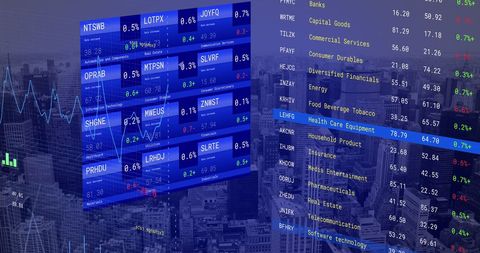
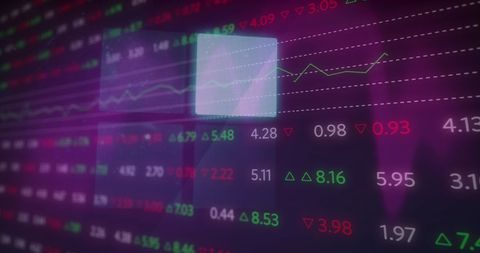
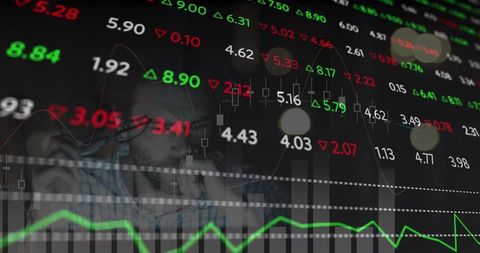
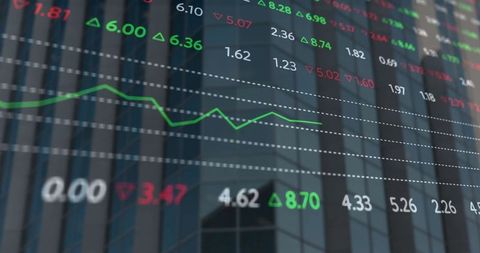
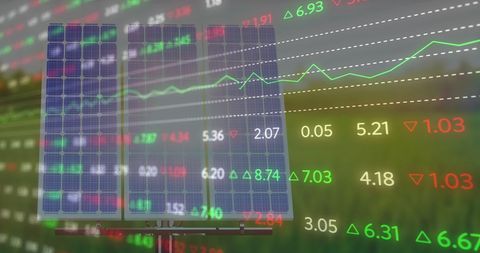
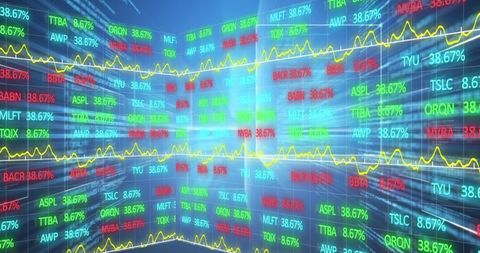
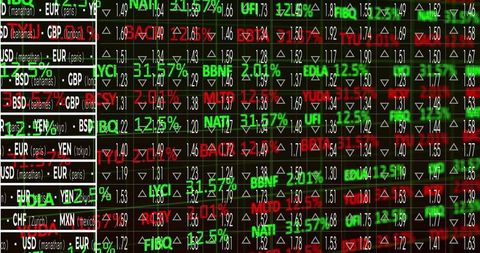
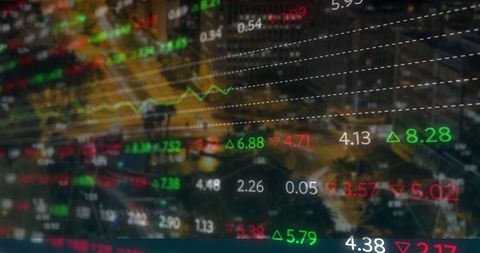
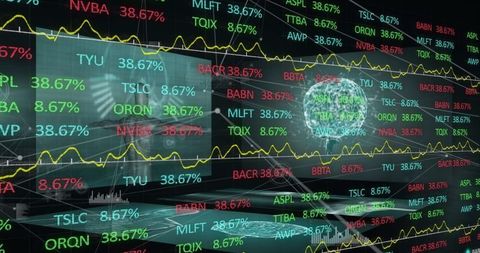
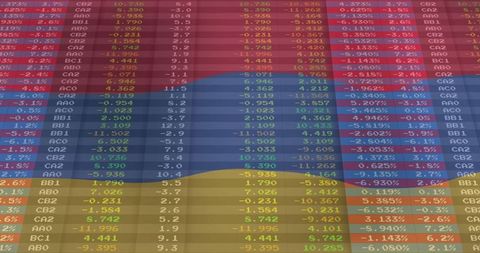
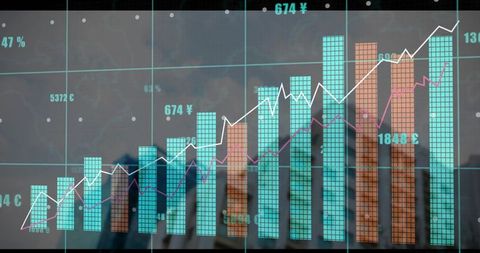
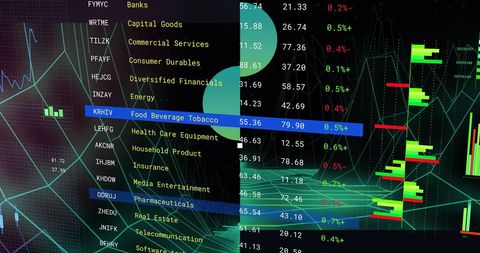
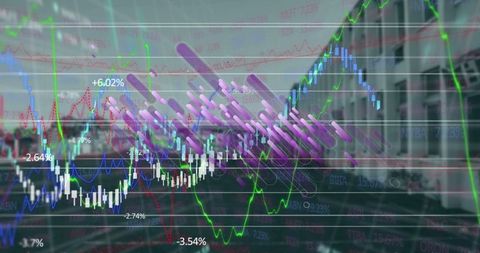
- Financial Data Analysis with Stock Market Graphs and Tickers
Financial Data Analysis with Stock Market Graphs and Tickers Image

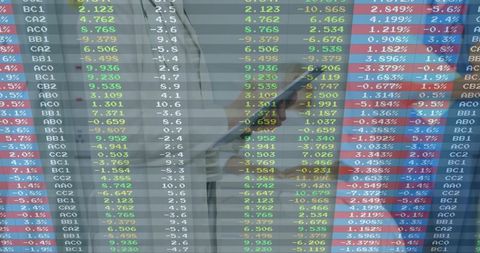
This image shows a blend of digital candlestick and line graphs superimposed on stock market tickers and percentage values. Perfect for illustrating concepts related to financial data analysis, stock market trends, or trading strategies. Use in business presentations, financial blogs, or investment educational materials to convey insights into market performance and economic analytics.
Powered by 


2
downloads
downloads
Tags:
More
Credit Photo
If you would like to credit the Photo, here are some ways you can do so
Text Link
photo Link
<span class="text-link">
<span>
<a target="_blank" href=https://pikwizard.com/photo/financial-data-analysis-with-stock-market-graphs-and-tickers/e37e2380528de413f568a216aab3fc9a/>PikWizard</a>
</span>
</span>
<span class="image-link">
<span
style="margin: 0 0 20px 0; display: inline-block; vertical-align: middle; width: 100%;"
>
<a
target="_blank"
href="https://pikwizard.com/photo/financial-data-analysis-with-stock-market-graphs-and-tickers/e37e2380528de413f568a216aab3fc9a/"
style="text-decoration: none; font-size: 10px; margin: 0;"
>
<img src="https://pikwizard.com/pw/medium/e37e2380528de413f568a216aab3fc9a.jpg" style="margin: 0; width: 100%;" alt="" />
<p style="font-size: 12px; margin: 0;">PikWizard</p>
</a>
</span>
</span>
Free (free of charge)
Free for personal and commercial use.
Author: Creative Art
Similar Free Stock Images
Premium


Premium


Premium


Premium


Premium


Premium


Premium


Premium


Premium


Premium


Premium

Premium

Premium


Premium


Premium


Premium


Premium


Premium

Premium


Premium


Premium


Premium


Premium


Premium


Premium