- Home >
- Stock Photos >
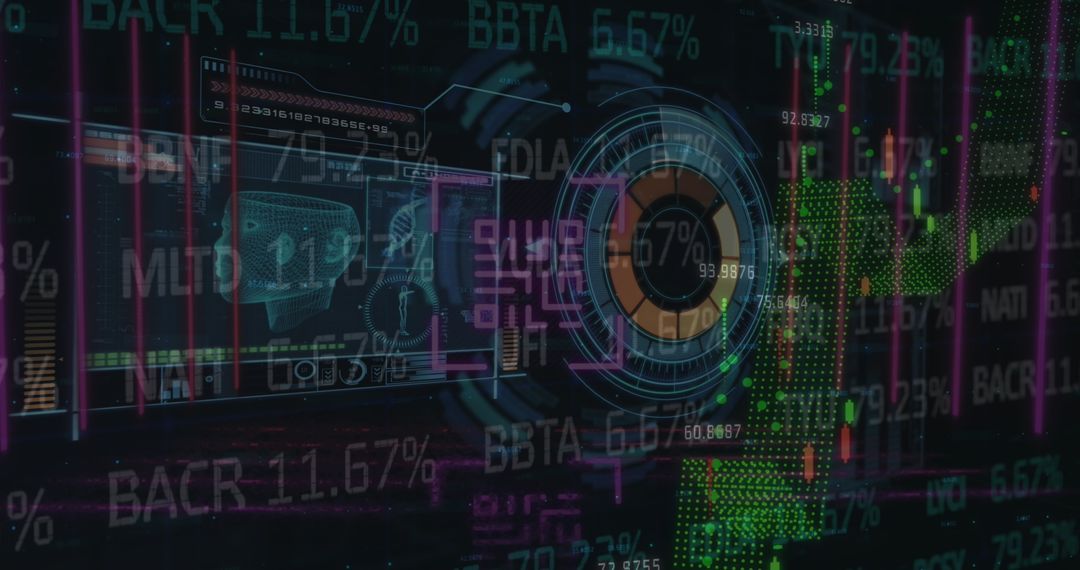
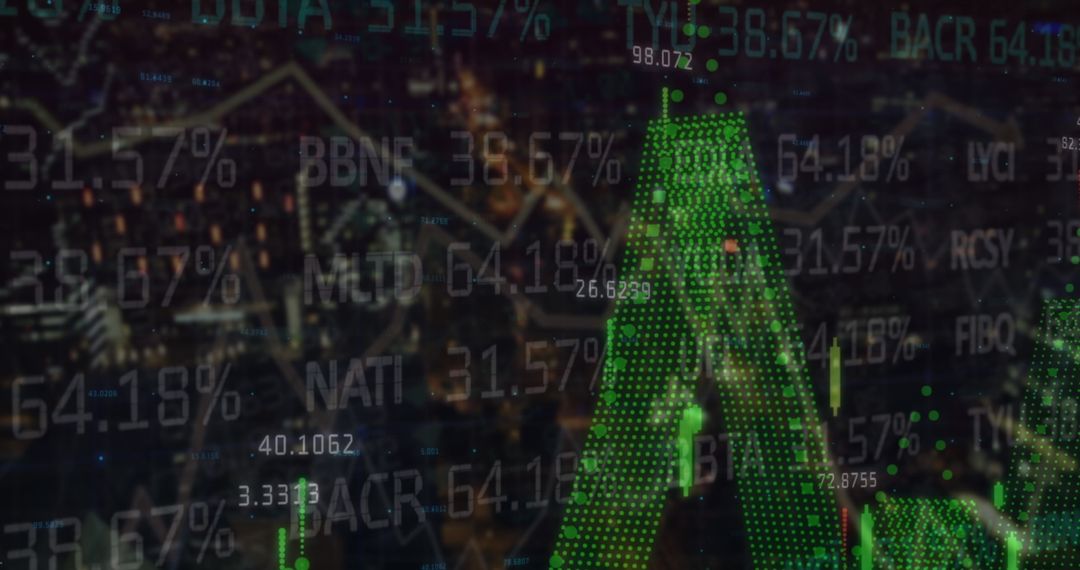
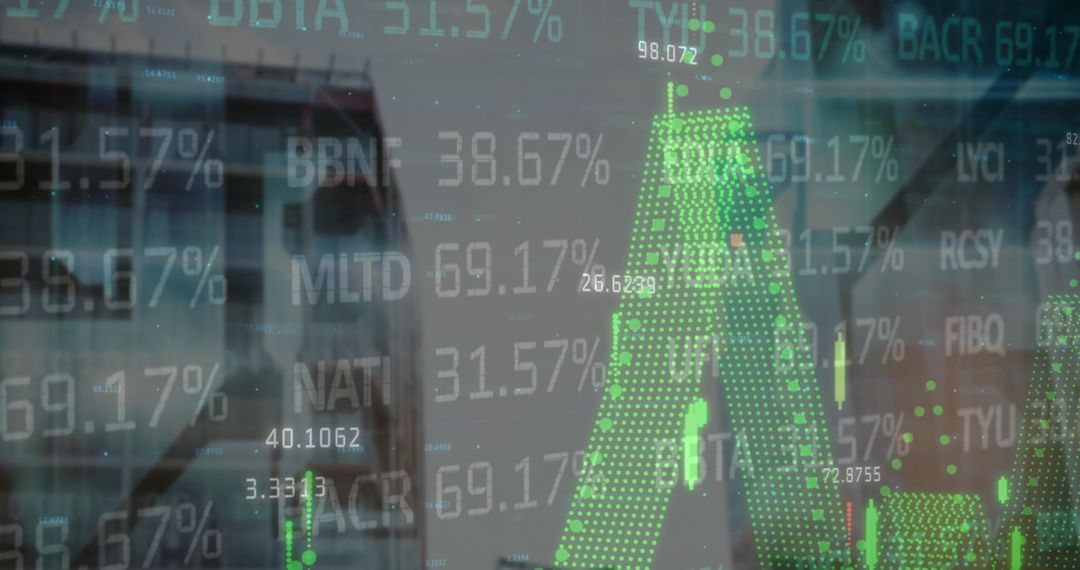
- Financial Data Analytics Interface with Rising Bar Chart and Tickers
Financial Data Analytics Interface with Rising Bar Chart and Tickers Image
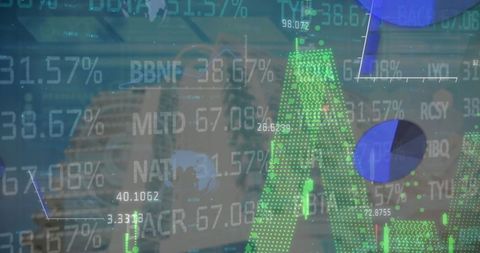
This visually appealing scene highlights a digital financial interface with a rising green dotted bar chart overlaid by stock tickers and pie charts. Ideal for use in contexts related to financial analytics, investment strategy discussions, digital technology showcases, or corporate presentations. The design reflects concepts of growth and innovation in the financial sector.
Powered by 


2
downloads
downloads
Tags:
More
Credit Photo
If you would like to credit the Photo, here are some ways you can do so
Text Link
photo Link
<span class="text-link">
<span>
<a target="_blank" href=https://pikwizard.com/photo/financial-data-analytics-interface-with-rising-bar-chart-and-tickers/73d57c6433198612741b9647ba894104/>PikWizard</a>
</span>
</span>
<span class="image-link">
<span
style="margin: 0 0 20px 0; display: inline-block; vertical-align: middle; width: 100%;"
>
<a
target="_blank"
href="https://pikwizard.com/photo/financial-data-analytics-interface-with-rising-bar-chart-and-tickers/73d57c6433198612741b9647ba894104/"
style="text-decoration: none; font-size: 10px; margin: 0;"
>
<img src="https://pikwizard.com/pw/medium/73d57c6433198612741b9647ba894104.jpg" style="margin: 0; width: 100%;" alt="" />
<p style="font-size: 12px; margin: 0;">PikWizard</p>
</a>
</span>
</span>
Free (free of charge)
Free for personal and commercial use.
Author: Awesome Content
Similar Free Stock Images

Premium


Premium


Premium


Premium


Premium


Premium


Premium


Premium


Premium


Premium


Premium


Premium


Premium


Premium


Premium


Premium


Premium


Premium


Premium


Premium


Premium


Premium


Premium


Premium