- Home >
- Stock Photos >
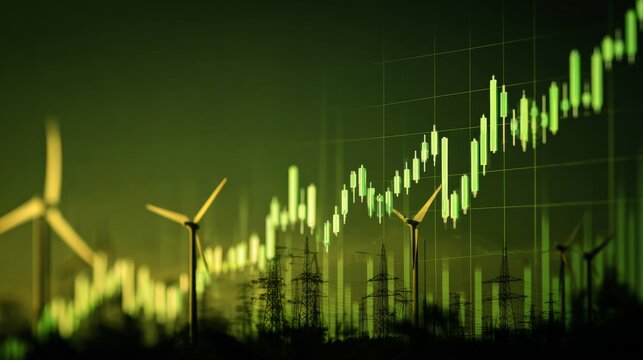
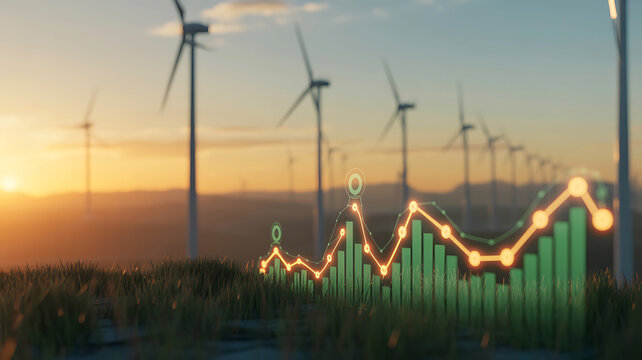
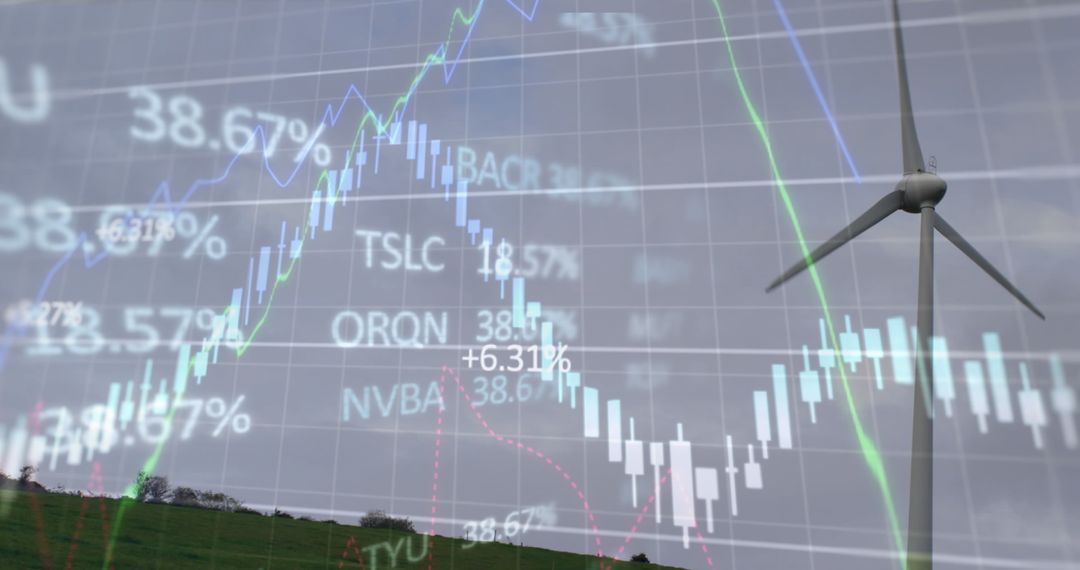
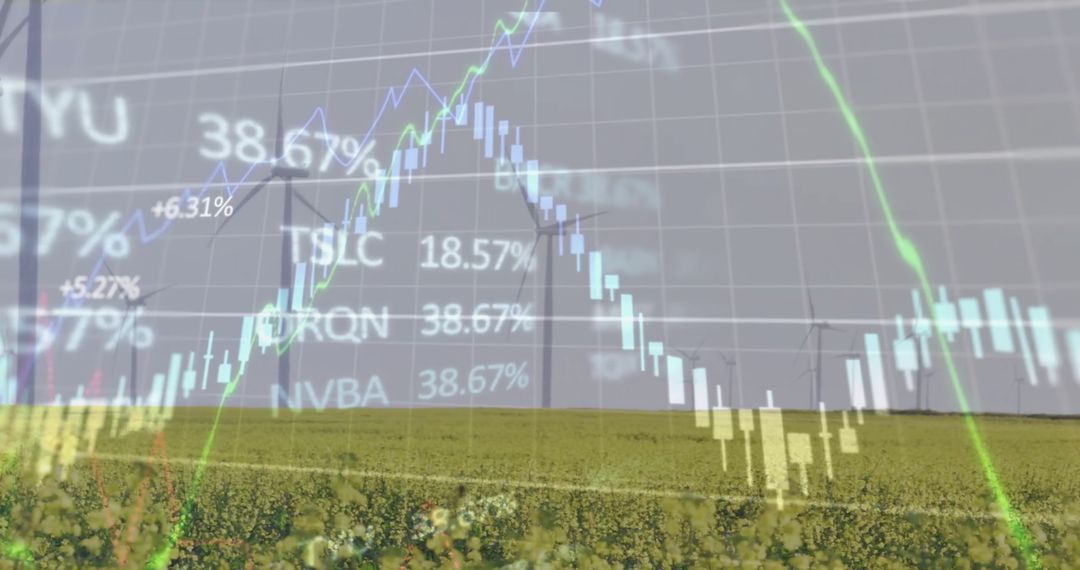
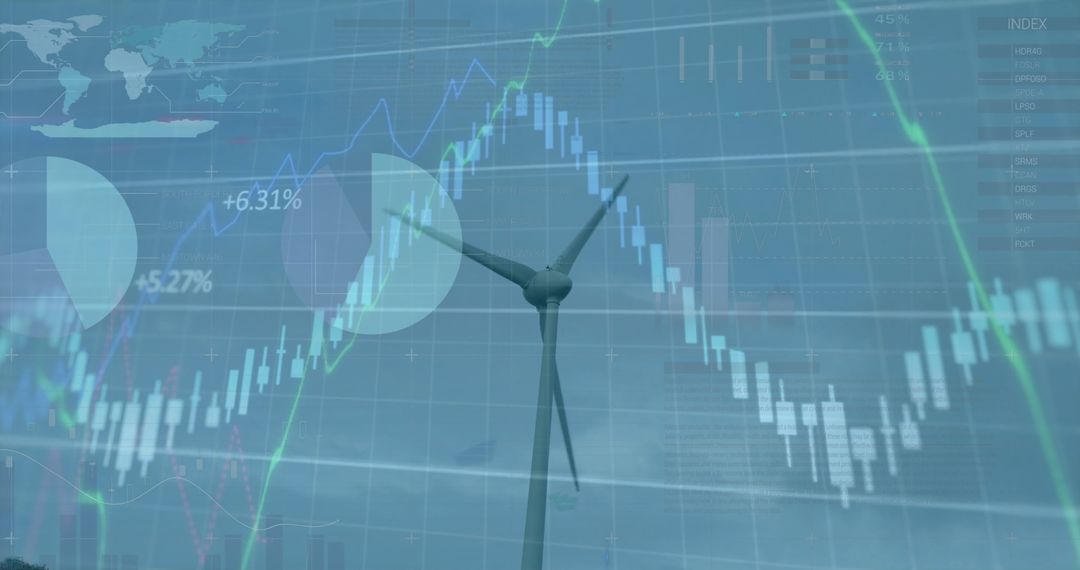
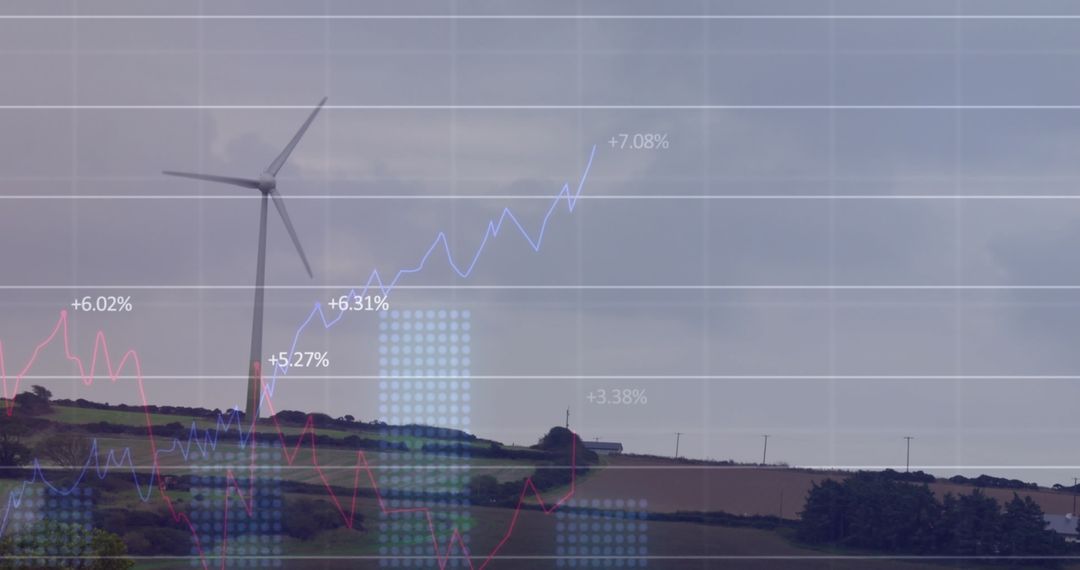
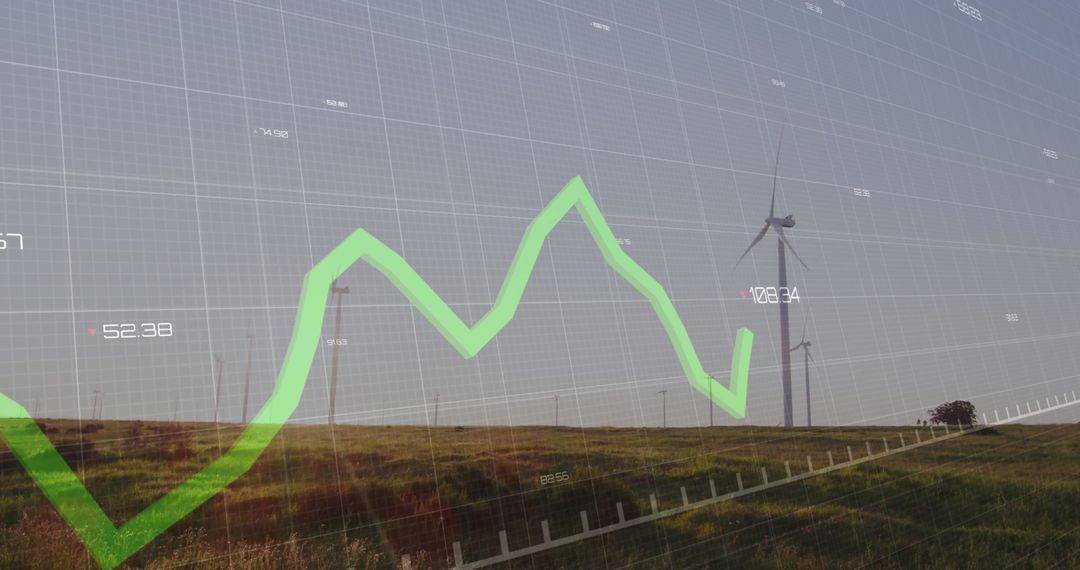
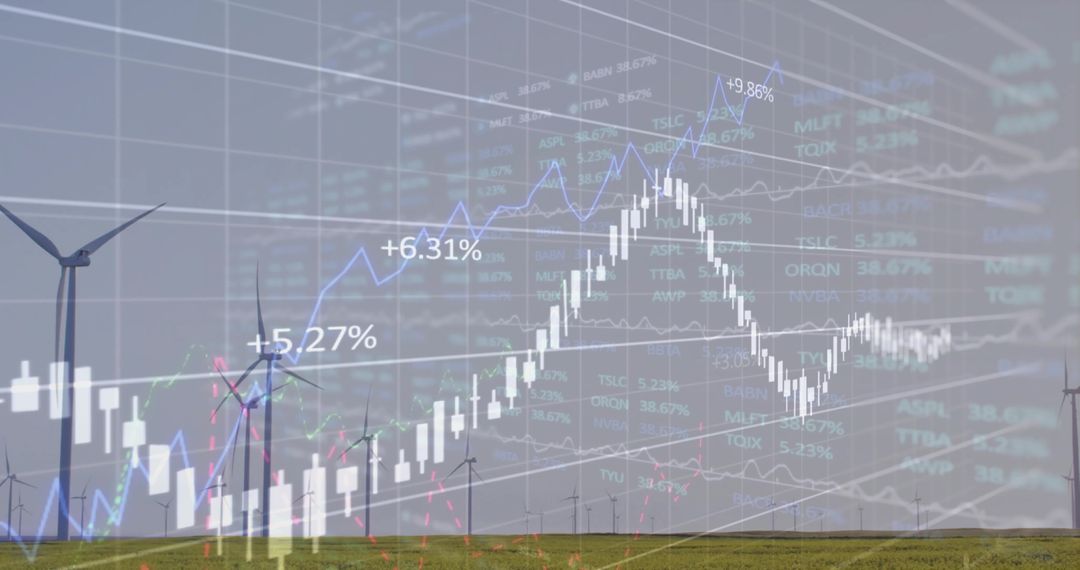
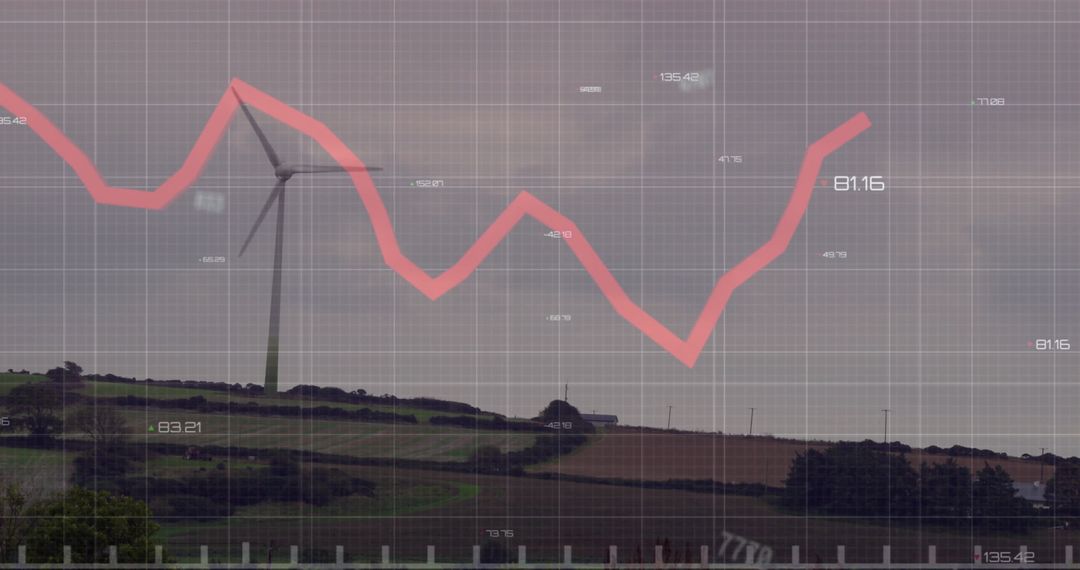
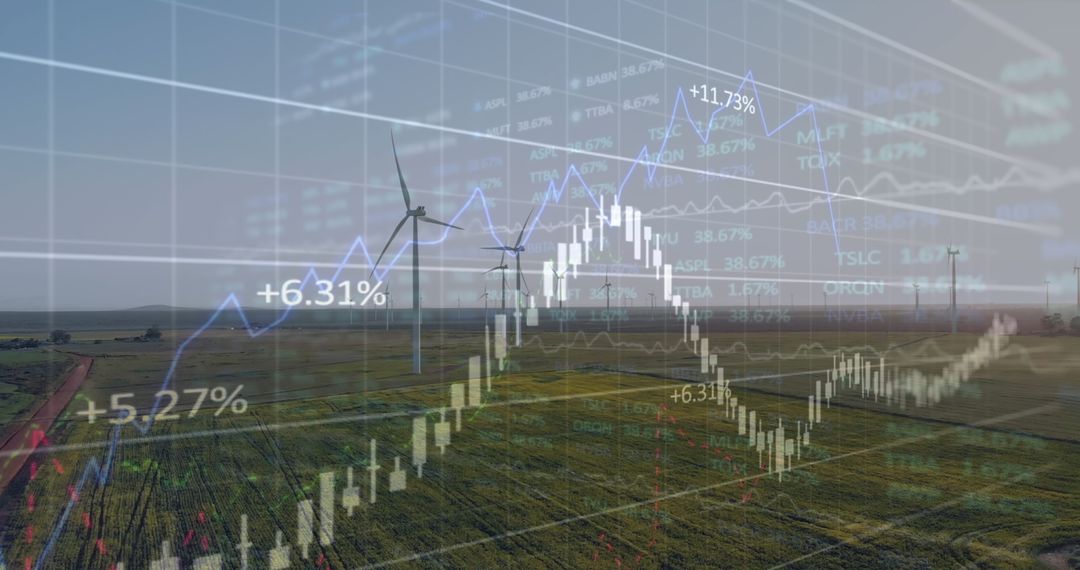
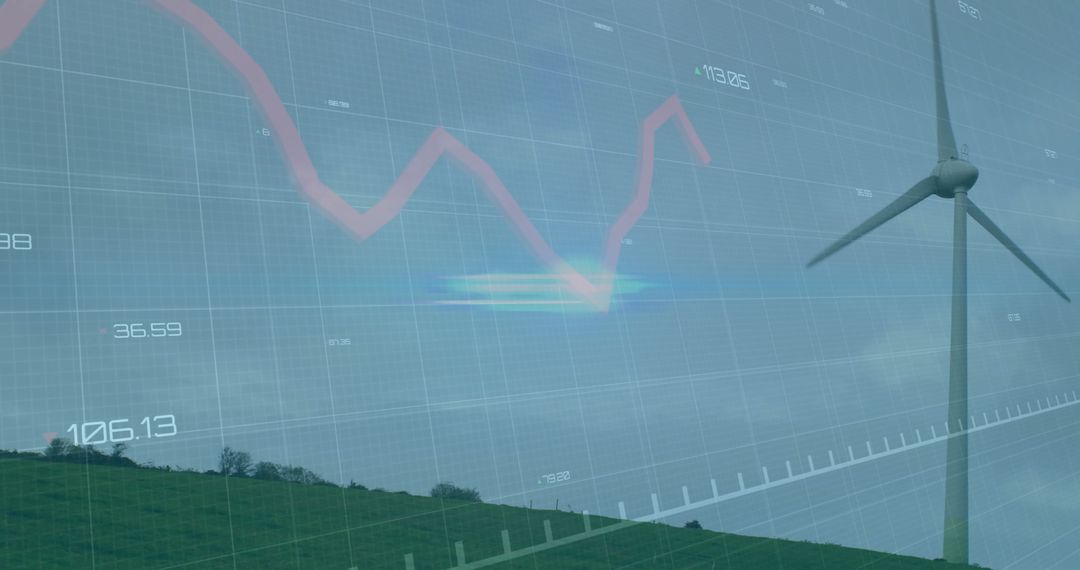
- Financial Data Analytics Overlaid on Windmills in Renewable Energy Context
Financial Data Analytics Overlaid on Windmills in Renewable Energy Context Image

Combining elements of finance with sustainable energy, this visual showcases the intersection of financial data and renewable energy. Appropriate for use in reports, articles, or presentations discussing investment in clean energy, analyzing financial growth areas within renewable sectors, or the economic impact of sustainable technologies. Useful for industry professionals, educators, or media setting the narrative on innovation in finance and energy.
Powered by 


2
downloads
downloads
Tags:
More
Credit Photo
If you would like to credit the Photo, here are some ways you can do so
Text Link
photo Link
<span class="text-link">
<span>
<a target="_blank" href=https://pikwizard.com/photo/financial-data-analytics-overlaid-on-windmills-in-renewable-energy-context/9bb77b37665a7d0439b07f53dea4ed29/>PikWizard</a>
</span>
</span>
<span class="image-link">
<span
style="margin: 0 0 20px 0; display: inline-block; vertical-align: middle; width: 100%;"
>
<a
target="_blank"
href="https://pikwizard.com/photo/financial-data-analytics-overlaid-on-windmills-in-renewable-energy-context/9bb77b37665a7d0439b07f53dea4ed29/"
style="text-decoration: none; font-size: 10px; margin: 0;"
>
<img src="https://pikwizard.com/pw/medium/9bb77b37665a7d0439b07f53dea4ed29.jpg" style="margin: 0; width: 100%;" alt="" />
<p style="font-size: 12px; margin: 0;">PikWizard</p>
</a>
</span>
</span>
Free (free of charge)
Free for personal and commercial use.
Author: People Creations
Similar Free Stock Images
Premium


Premium


Premium


Premium


Premium


Premium


Premium


Premium


Premium


Premium


Premium


Premium


Premium


Premium


Premium


Premium


Premium


Premium


Premium


Premium


Premium


Premium


Premium


Premium