- Home >
- Stock Photos >
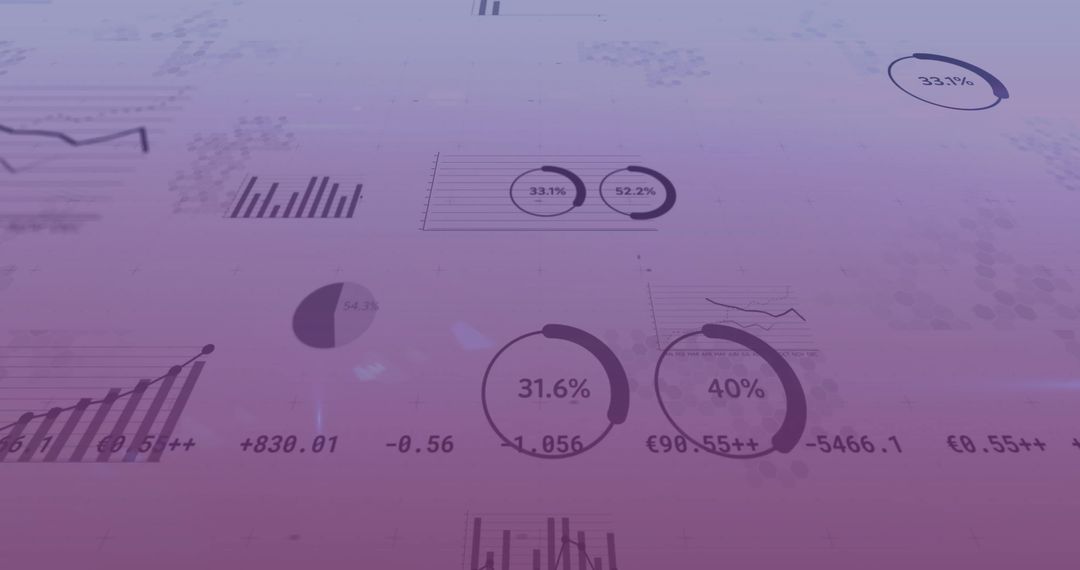
- Financial Data and Graphs over Green Background for Business
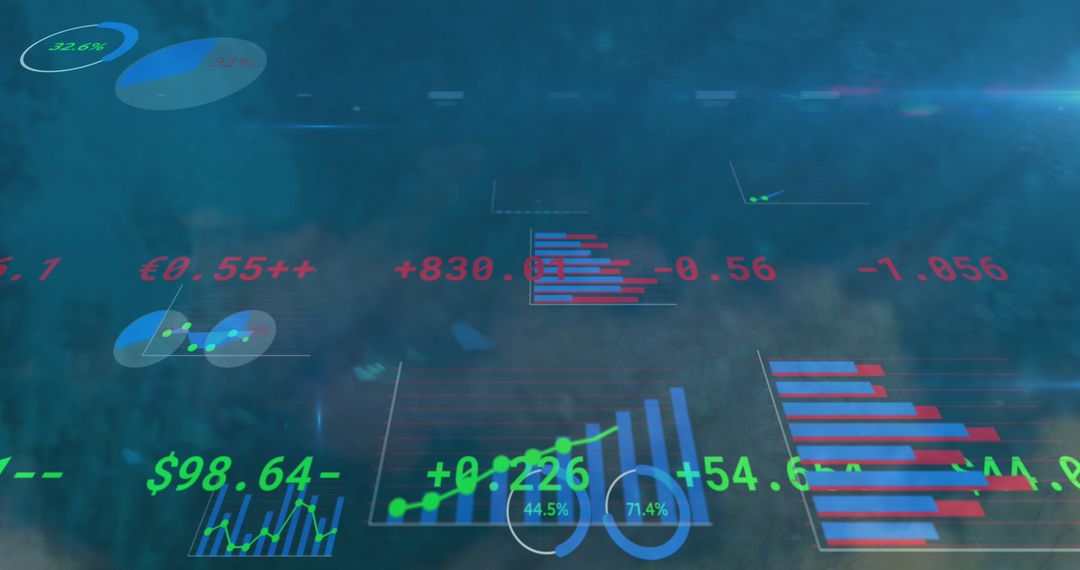
Financial Data and Graphs over Green Background for Business Image
Abstract visualization of financial data and analytics with overlayed charts and percentages on a green background. Ideal for representing modern business strategies, economic trends, and future investment opportunities. Could be used in presentations, reports, websites, or marketing materials related to finance and tech innovation.
Powered by  - Get 15% off with code: PIKWIZARD15


2
downloads
downloads
Tags:
More
Credit Photo
If you would like to credit the Photo, here are some ways you can do so
Text Link
photo Link
<span class="text-link">
<span>
<a target="_blank" href=https://pikwizard.com/photo/financial-data-and-graphs-over-green-background-for-business/fd86f6e66410ba429a0e265c59d41632/>PikWizard</a>
</span>
</span>
<span class="image-link">
<span
style="margin: 0 0 20px 0; display: inline-block; vertical-align: middle; width: 100%;"
>
<a
target="_blank"
href="https://pikwizard.com/photo/financial-data-and-graphs-over-green-background-for-business/fd86f6e66410ba429a0e265c59d41632/"
style="text-decoration: none; font-size: 10px; margin: 0;"
>
<img src="https://pikwizard.com/pw/medium/fd86f6e66410ba429a0e265c59d41632.jpg" style="margin: 0; width: 100%;" alt="" />
<p style="font-size: 12px; margin: 0;">PikWizard</p>
</a>
</span>
</span>
Free (free of charge)
Free for personal and commercial use.
Author: Awesome Content
Similar Free Stock Images
Premium


Premium

Premium

Premium


Premium


Premium


Premium


Premium

Premium


Premium


Premium


Premium


Premium


Premium


Premium


Premium


Premium

Premium


Premium

Premium


Premium


Premium


Premium


Premium