
- Home >
- Stock Photos >
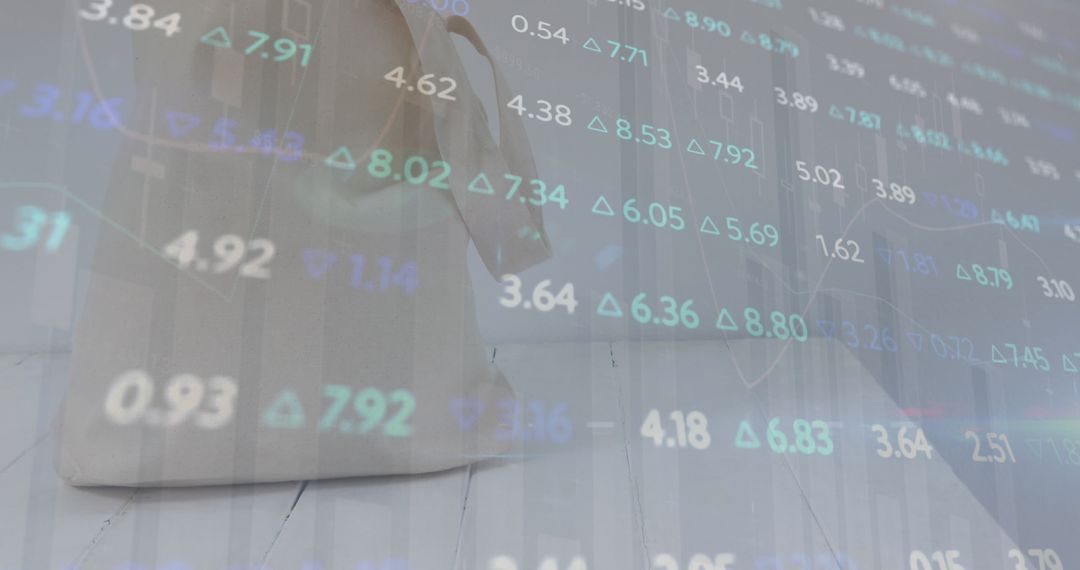
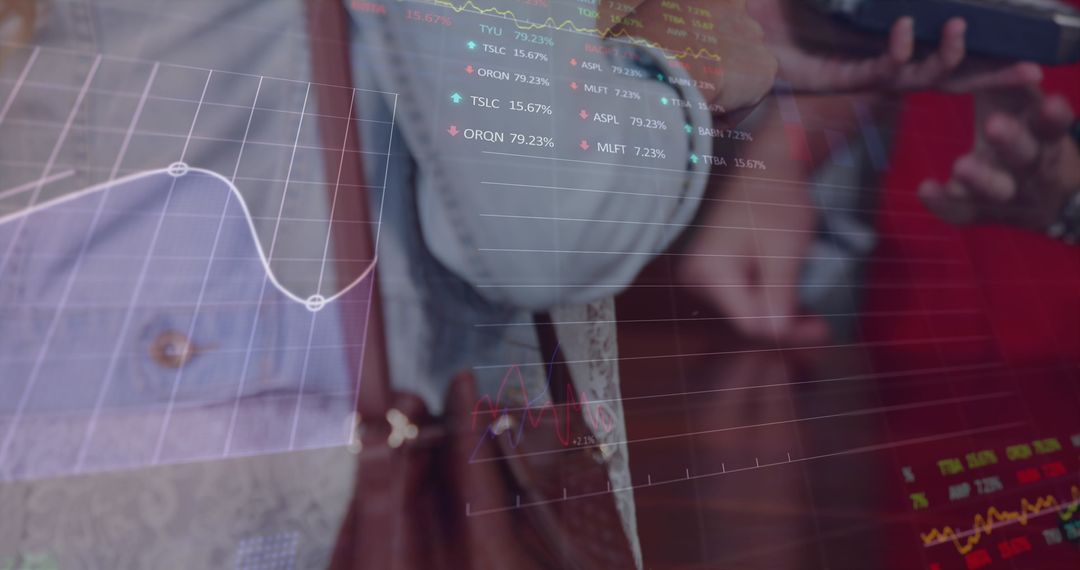
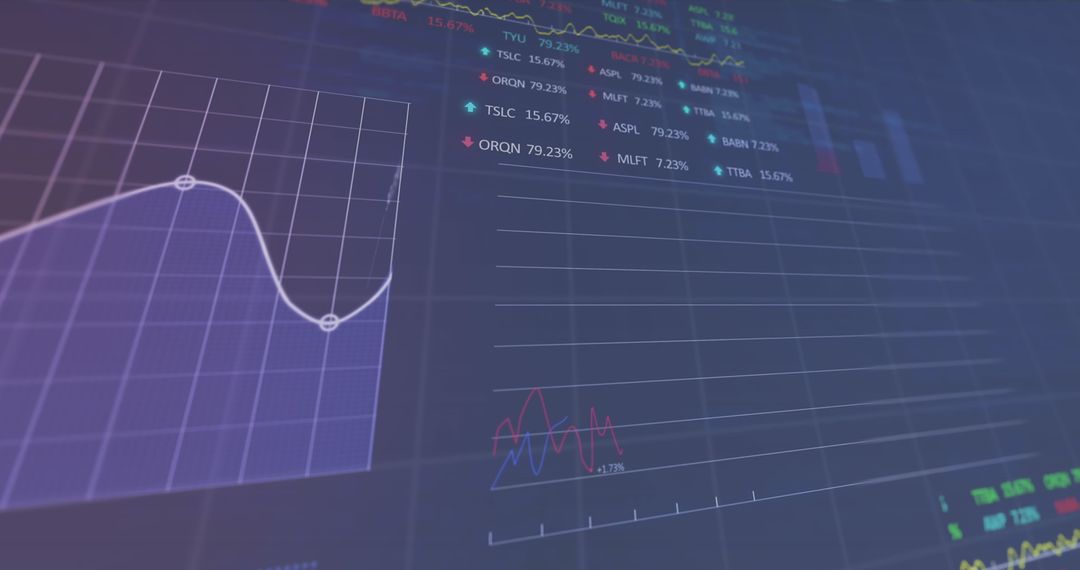
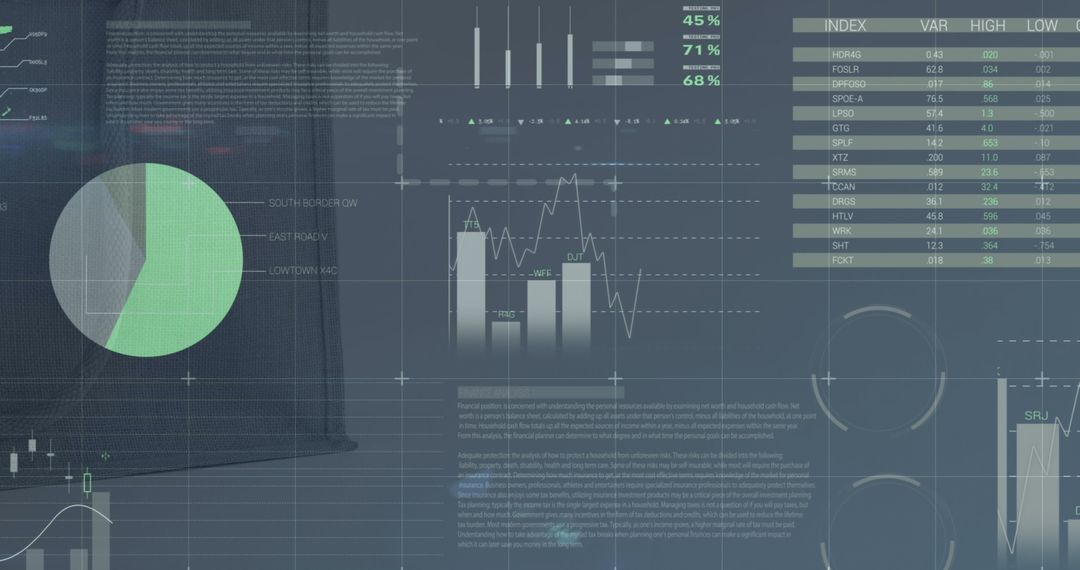
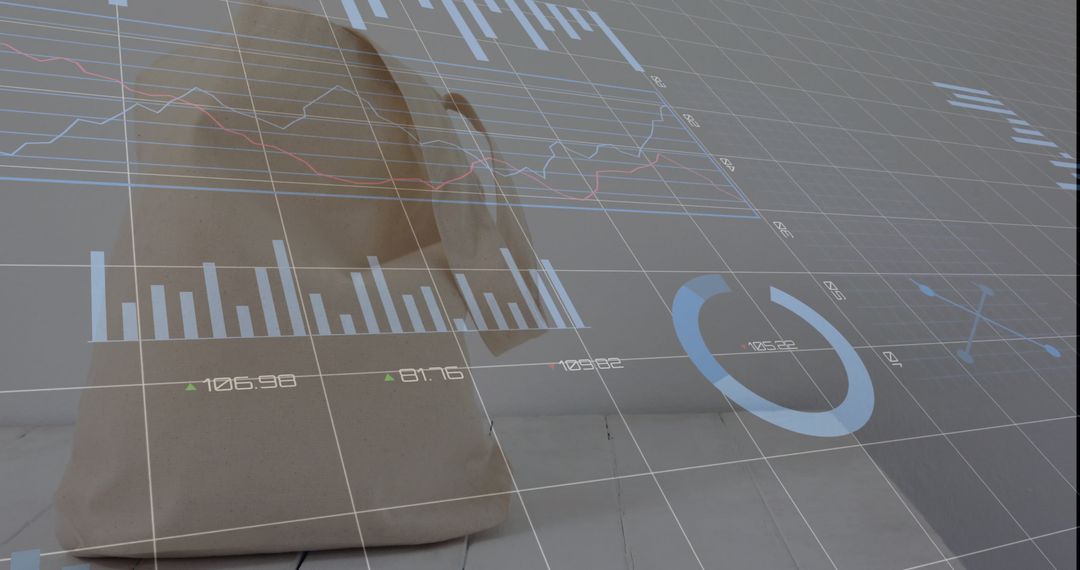
- Financial Data and Growth Chart Overlay on Shopping Bag
Financial Data and Growth Chart Overlay on Shopping Bag Image
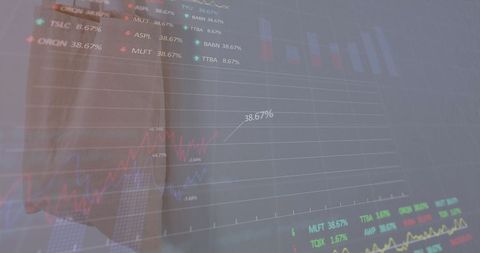
An overlay of financial data and growth charts suggests a connection between market trends and consumer activities. The blend of finance and shopping visuals is ideal for illustrating economic analysis presentations, articles on market trends, or advertising financial services targeting consumers.
Powered by  - Get 15% off with code: PIKWIZARD15


2
downloads
downloads
Tags:
More
Credit Photo
If you would like to credit the Photo, here are some ways you can do so
Text Link
photo Link
<span class="text-link">
<span>
<a target="_blank" href=https://pikwizard.com/photo/financial-data-and-growth-chart-overlay-on-shopping-bag/1305b98a2c877d19a427d66b6a7d59c5/>PikWizard</a>
</span>
</span>
<span class="image-link">
<span
style="margin: 0 0 20px 0; display: inline-block; vertical-align: middle; width: 100%;"
>
<a
target="_blank"
href="https://pikwizard.com/photo/financial-data-and-growth-chart-overlay-on-shopping-bag/1305b98a2c877d19a427d66b6a7d59c5/"
style="text-decoration: none; font-size: 10px; margin: 0;"
>
<img src="https://pikwizard.com/pw/medium/1305b98a2c877d19a427d66b6a7d59c5.jpg" style="margin: 0; width: 100%;" alt="" />
<p style="font-size: 12px; margin: 0;">PikWizard</p>
</a>
</span>
</span>
Free (free of charge)
Free for personal and commercial use.
Author: Authentic Images
Similar Free Stock Images

Premium


Premium


Premium


Premium


Premium


Premium


Premium


Premium


Premium


Premium


Premium


Premium


Premium


Premium


Premium


Premium


Premium


Premium


Premium


Premium


Premium


Premium


Premium


Premium

