- Home >
- Stock Photos >
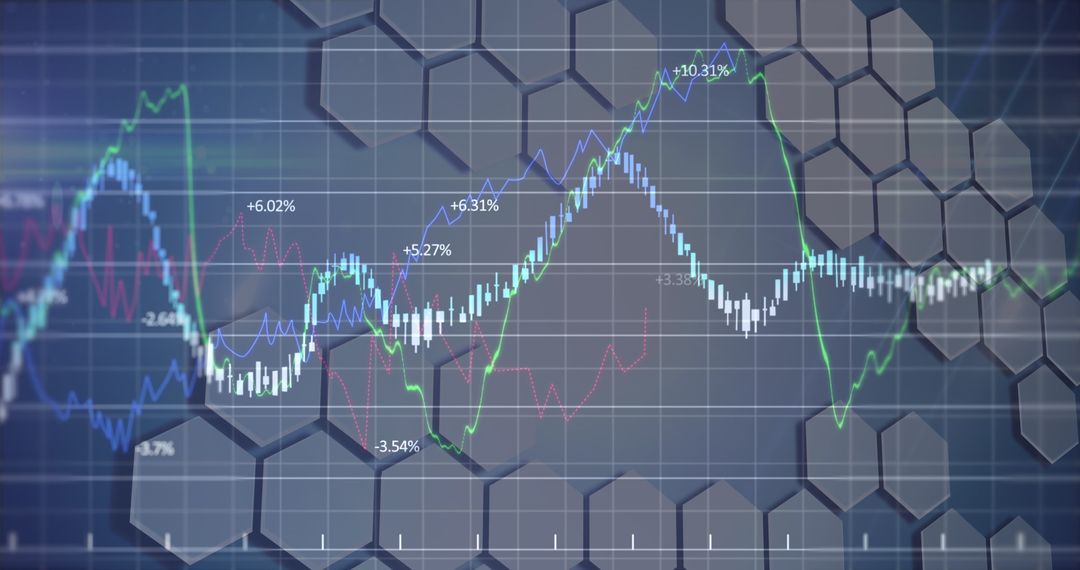
- Financial Data and Stock Market Analysis with Digital Overlay
Financial Data and Stock Market Analysis with Digital Overlay Image

This image depicting financial data and stock market analysis in a digital format, featuring a hexagonal grid and graph overlays, can be integral for use in financial reports, investment analysis, business presentations, and educational content about market trends and data analytics.
Powered by  - Get 15% off with code: PIKWIZARD15


2
downloads
downloads
Tags:
More
Credit Photo
If you would like to credit the Photo, here are some ways you can do so
Text Link
photo Link
<span class="text-link">
<span>
<a target="_blank" href=https://pikwizard.com/photo/financial-data-and-stock-market-analysis-with-digital-overlay/15a959fbd11e13f2a6736daf484a891c/>PikWizard</a>
</span>
</span>
<span class="image-link">
<span
style="margin: 0 0 20px 0; display: inline-block; vertical-align: middle; width: 100%;"
>
<a
target="_blank"
href="https://pikwizard.com/photo/financial-data-and-stock-market-analysis-with-digital-overlay/15a959fbd11e13f2a6736daf484a891c/"
style="text-decoration: none; font-size: 10px; margin: 0;"
>
<img src="https://pikwizard.com/pw/medium/15a959fbd11e13f2a6736daf484a891c.jpg" style="margin: 0; width: 100%;" alt="" />
<p style="font-size: 12px; margin: 0;">PikWizard</p>
</a>
</span>
</span>
Free (free of charge)
Free for personal and commercial use.
Author: Authentic Images
Similar Free Stock Images

Premium


Premium


Premium


Premium


Premium


Premium


Premium


Premium


Premium


Premium


Premium


Premium


Premium


Premium


Premium


Premium


Premium


Premium


Premium


Premium


Premium


Premium


Premium


Premium