- Home >
- Stock Photos >
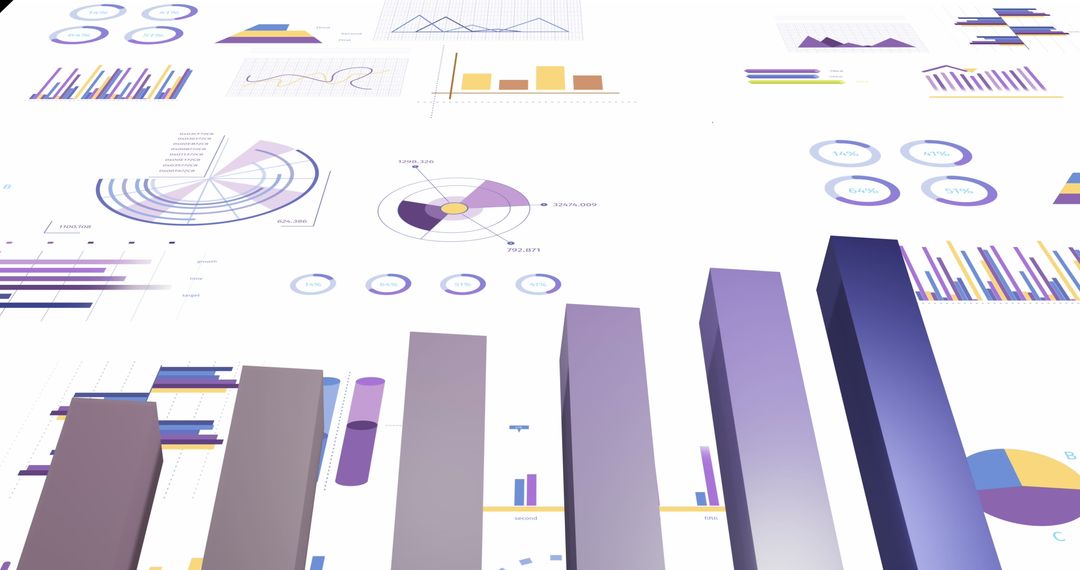
- Financial Data Charts and Graphs with Blue Highlights for Analytics
Financial Data Charts and Graphs with Blue Highlights for Analytics Image

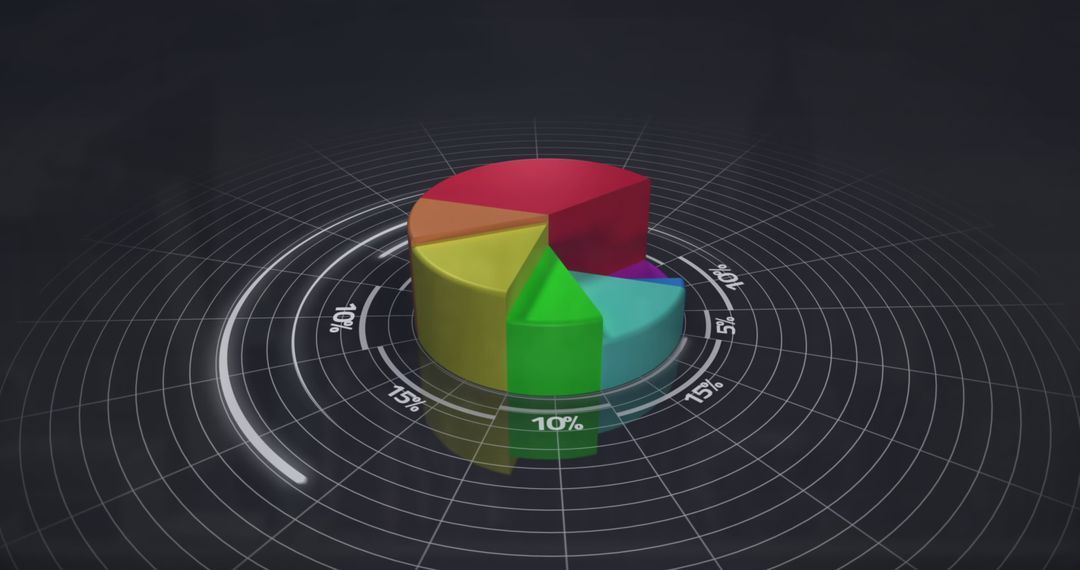
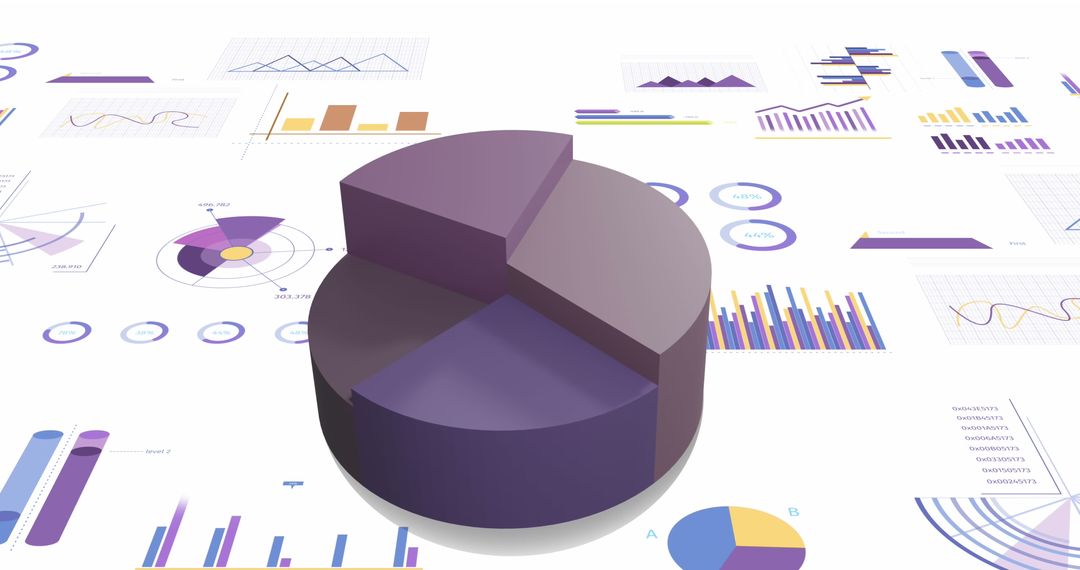
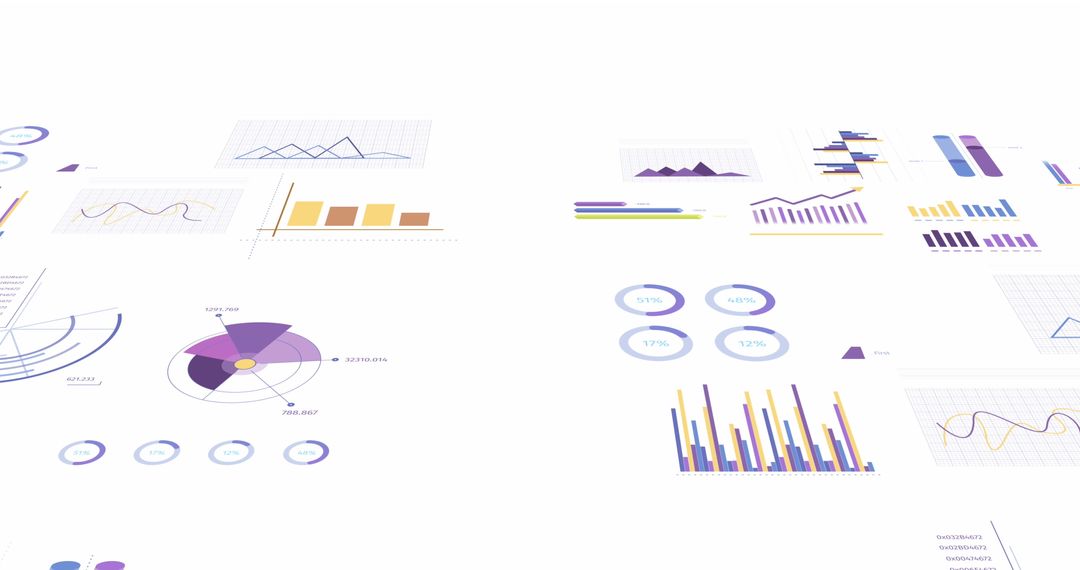
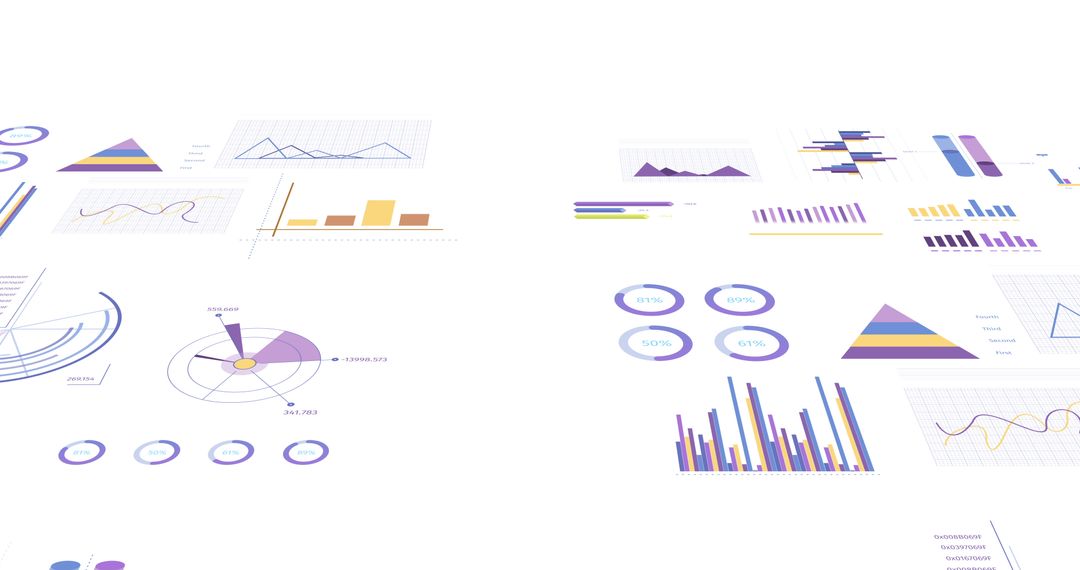
This stock photo depicts various graphical representations of data such as pie charts, line graphs, and bar graphs, emphasizing financial analytics and data processing. The use of purple and blue enhances visualization, making it suitable for presentations, business reports, or educational materials focused on finance, economics, and data analysis trends.
Powered by 


2
downloads
downloads
Tags:
More
Credit Photo
If you would like to credit the Photo, here are some ways you can do so
Text Link
photo Link
<span class="text-link">
<span>
<a target="_blank" href=https://pikwizard.com/photo/financial-data-charts-and-graphs-with-blue-highlights-for-analytics/296ebbf847d723e47fee5a0887f1fc7c/>PikWizard</a>
</span>
</span>
<span class="image-link">
<span
style="margin: 0 0 20px 0; display: inline-block; vertical-align: middle; width: 100%;"
>
<a
target="_blank"
href="https://pikwizard.com/photo/financial-data-charts-and-graphs-with-blue-highlights-for-analytics/296ebbf847d723e47fee5a0887f1fc7c/"
style="text-decoration: none; font-size: 10px; margin: 0;"
>
<img src="https://pikwizard.com/pw/medium/296ebbf847d723e47fee5a0887f1fc7c.jpg" style="margin: 0; width: 100%;" alt="" />
<p style="font-size: 12px; margin: 0;">PikWizard</p>
</a>
</span>
</span>
Free (free of charge)
Free for personal and commercial use.
Author: Awesome Content
Similar Free Stock Images

Premium


Premium


Premium


Premium


Premium


Premium


Premium