- Home >
- Stock Photos >
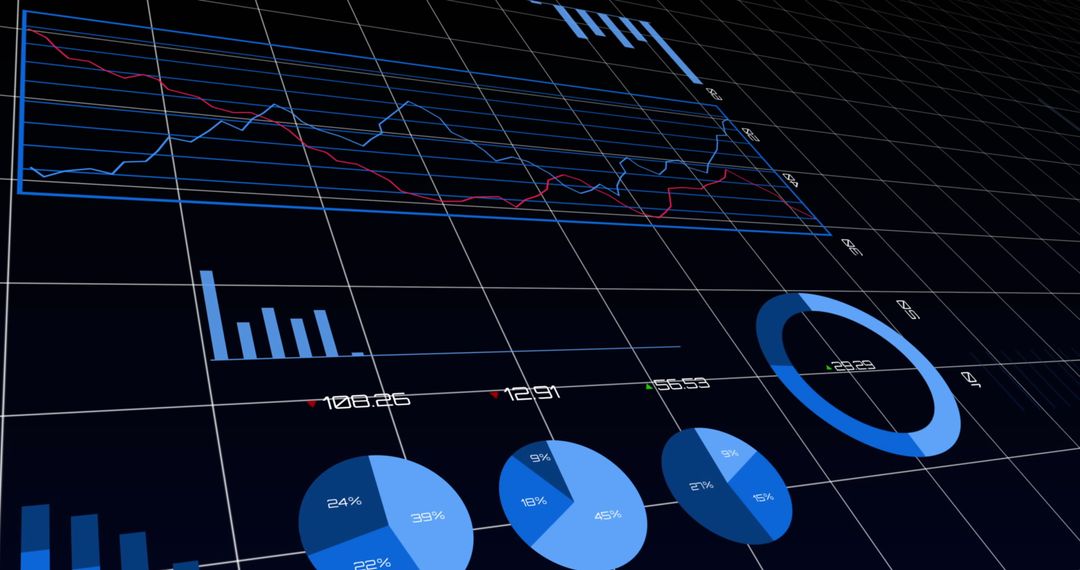
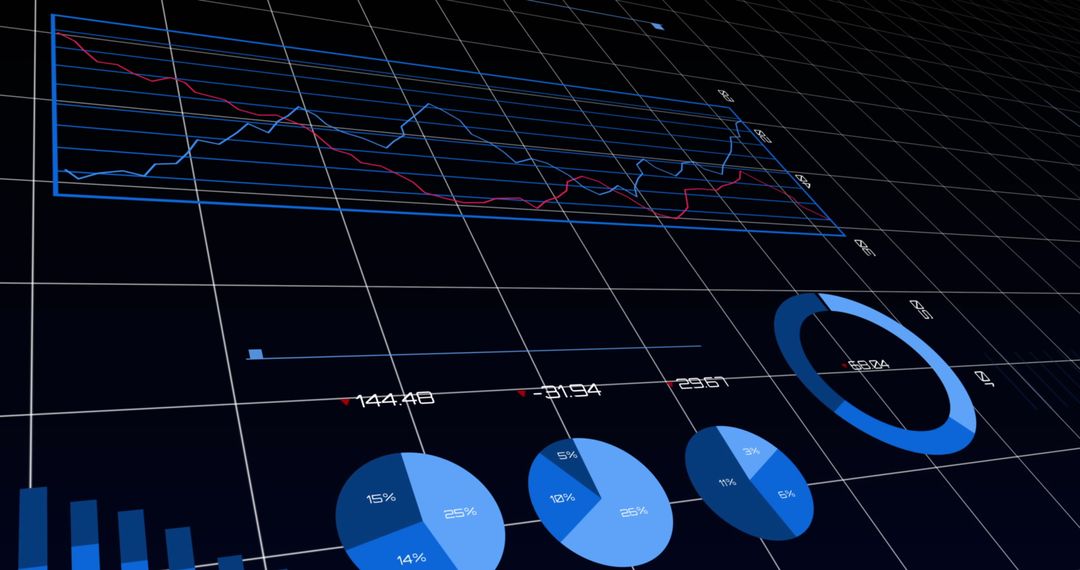
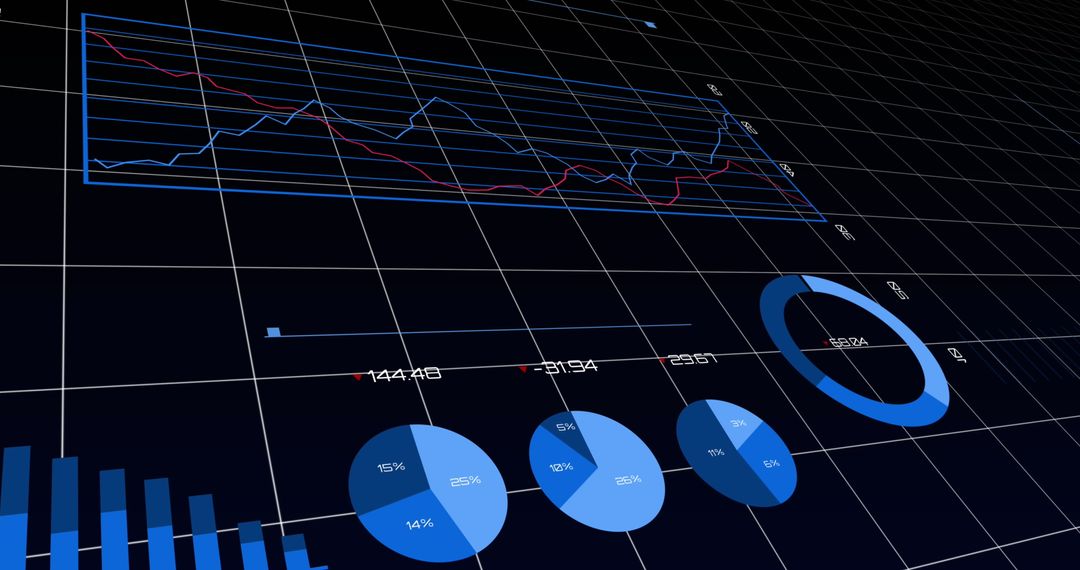
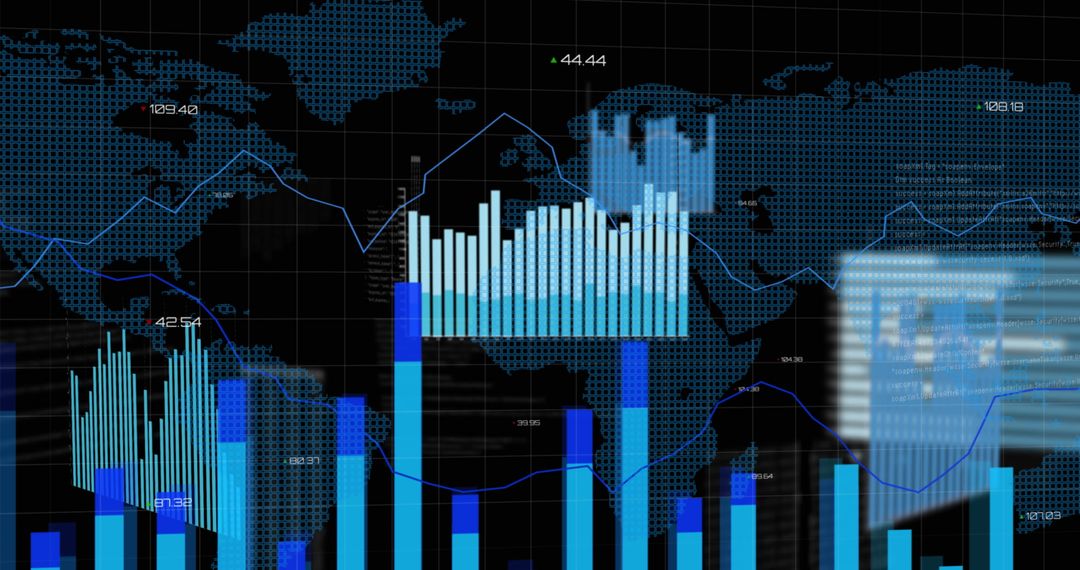
- Financial Data Charts Featuring Blue Graphs and Pie Chart
Financial Data Charts Featuring Blue Graphs and Pie Chart Image

Digital illustration of financial data with a focus on blue-toned bar graphs and a pie chart. Suitable for articles on economic trends, data analysis, business finance, or corporate presentations, this visual can enhance content focusing on statistical breakdowns and financial projections in a global context.
Powered by 


0
downloads
downloads
Tags:
More
Credit Photo
If you would like to credit the Photo, here are some ways you can do so
Text Link
photo Link
<span class="text-link">
<span>
<a target="_blank" href=https://pikwizard.com/photo/financial-data-charts-featuring-blue-graphs-and-pie-chart/591d71f933b53b62ba50b1e85bf7cc4c/>PikWizard</a>
</span>
</span>
<span class="image-link">
<span
style="margin: 0 0 20px 0; display: inline-block; vertical-align: middle; width: 100%;"
>
<a
target="_blank"
href="https://pikwizard.com/photo/financial-data-charts-featuring-blue-graphs-and-pie-chart/591d71f933b53b62ba50b1e85bf7cc4c/"
style="text-decoration: none; font-size: 10px; margin: 0;"
>
<img src="https://pikwizard.com/pw/medium/591d71f933b53b62ba50b1e85bf7cc4c.jpg" style="margin: 0; width: 100%;" alt="" />
<p style="font-size: 12px; margin: 0;">PikWizard</p>
</a>
</span>
</span>
Free (free of charge)
Free for personal and commercial use.
Author: Authentic Images
Similar Free Stock Images

Premium


Premium


Premium


Premium


Premium


Premium


Premium


Premium


Premium


Premium


Premium


Premium


Premium


Premium


Premium


Premium


Premium


Premium


Premium


Premium


Premium


Premium


Premium


Premium