- Home >
- Stock Photos >
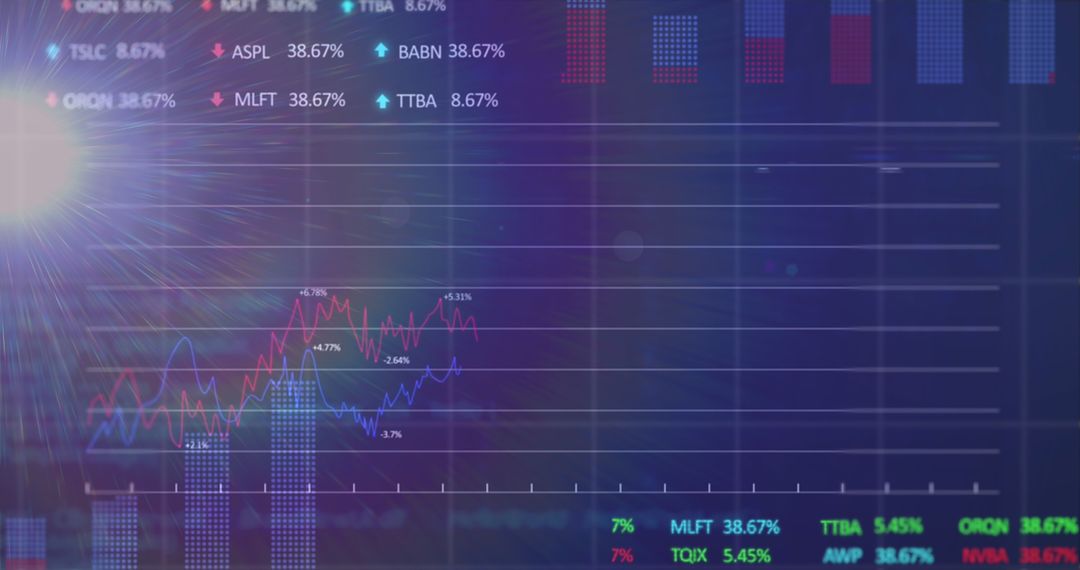
- Financial Data Charts with Viewing Grid in Dark Perspective
Financial Data Charts with Viewing Grid in Dark Perspective Image

This image portrays financial line graphs on a gridded interface, engaging with concepts such as stock markets, investments, and economic trends. Suitable for use in articles on finance, economic analysis blog posts, financial presentations, or any material related to data-driven decision-making, finance, and investments.
Powered by  - Get 15% off with code: PIKWIZARD15


2
downloads
downloads
Tags:
More
Credit Photo
If you would like to credit the Photo, here are some ways you can do so
Text Link
photo Link
<span class="text-link">
<span>
<a target="_blank" href=https://pikwizard.com/photo/financial-data-charts-with-viewing-grid-in-dark-perspective/e26cbb06e1ed5509212481e5b329e57d/>PikWizard</a>
</span>
</span>
<span class="image-link">
<span
style="margin: 0 0 20px 0; display: inline-block; vertical-align: middle; width: 100%;"
>
<a
target="_blank"
href="https://pikwizard.com/photo/financial-data-charts-with-viewing-grid-in-dark-perspective/e26cbb06e1ed5509212481e5b329e57d/"
style="text-decoration: none; font-size: 10px; margin: 0;"
>
<img src="https://pikwizard.com/pw/medium/e26cbb06e1ed5509212481e5b329e57d.jpg" style="margin: 0; width: 100%;" alt="" />
<p style="font-size: 12px; margin: 0;">PikWizard</p>
</a>
</span>
</span>
Free (free of charge)
Free for personal and commercial use.
Author: People Creations
Similar Free Stock Images

Premium


Premium


Premium


Premium


Premium


Premium


Premium


Premium


Premium


Premium


Premium


Premium


Premium


Premium


Premium


Premium


Premium


Premium


Premium


Premium


Premium


Premium


Premium


Premium