- Home >
- Stock Photos >
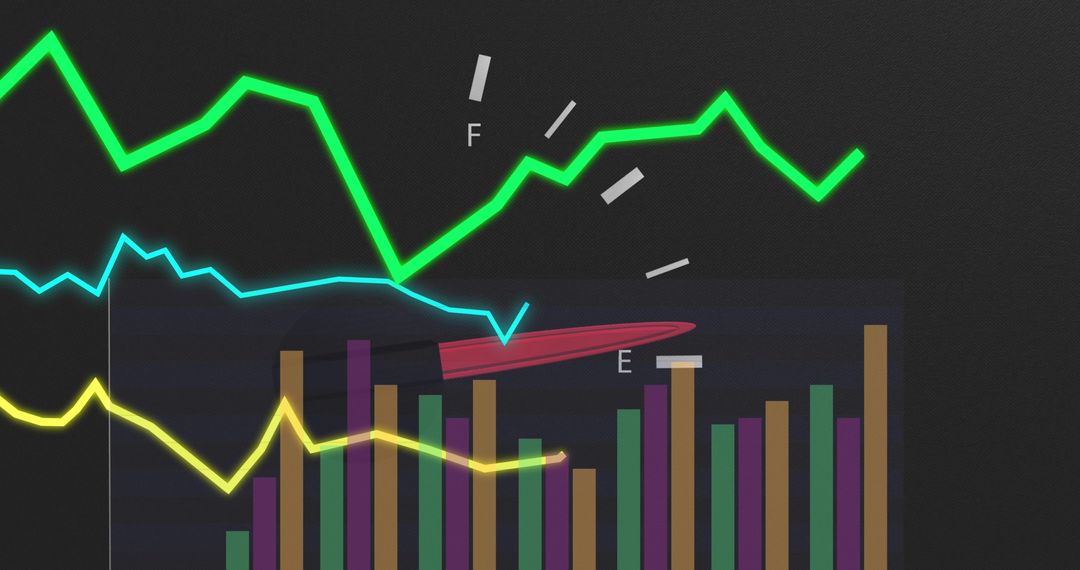
- Financial Data Graph Overlaying Cityscape Background
Financial Data Graph Overlaying Cityscape Background Image

Stylized graphic showing financial data chart blended over an urban skyline. Ideal for conveying concepts of finance, global business trends, or data analysis. Suitable for use in business reports, presentations, or promotional materials highlighting financial consultancy services or technological investments.
Powered by 


2
downloads
downloads
Tags:
More
Credit Photo
If you would like to credit the Photo, here are some ways you can do so
Text Link
photo Link
<span class="text-link">
<span>
<a target="_blank" href=https://pikwizard.com/photo/financial-data-graph-overlaying-cityscape-background/d0d34a832566eaa7d20058d72c2666c5/>PikWizard</a>
</span>
</span>
<span class="image-link">
<span
style="margin: 0 0 20px 0; display: inline-block; vertical-align: middle; width: 100%;"
>
<a
target="_blank"
href="https://pikwizard.com/photo/financial-data-graph-overlaying-cityscape-background/d0d34a832566eaa7d20058d72c2666c5/"
style="text-decoration: none; font-size: 10px; margin: 0;"
>
<img src="https://pikwizard.com/pw/medium/d0d34a832566eaa7d20058d72c2666c5.jpg" style="margin: 0; width: 100%;" alt="" />
<p style="font-size: 12px; margin: 0;">PikWizard</p>
</a>
</span>
</span>
Free (free of charge)
Free for personal and commercial use.
Author: Awesome Content
Similar Free Stock Images

Premium


Premium


Premium


Premium


Premium


Premium


Premium


Premium


Premium


Premium


Premium


Premium


Premium


Premium


Premium


Premium


Premium


Premium


Premium


Premium


Premium


Premium


Premium


Premium