
- Home >
- Stock Photos >
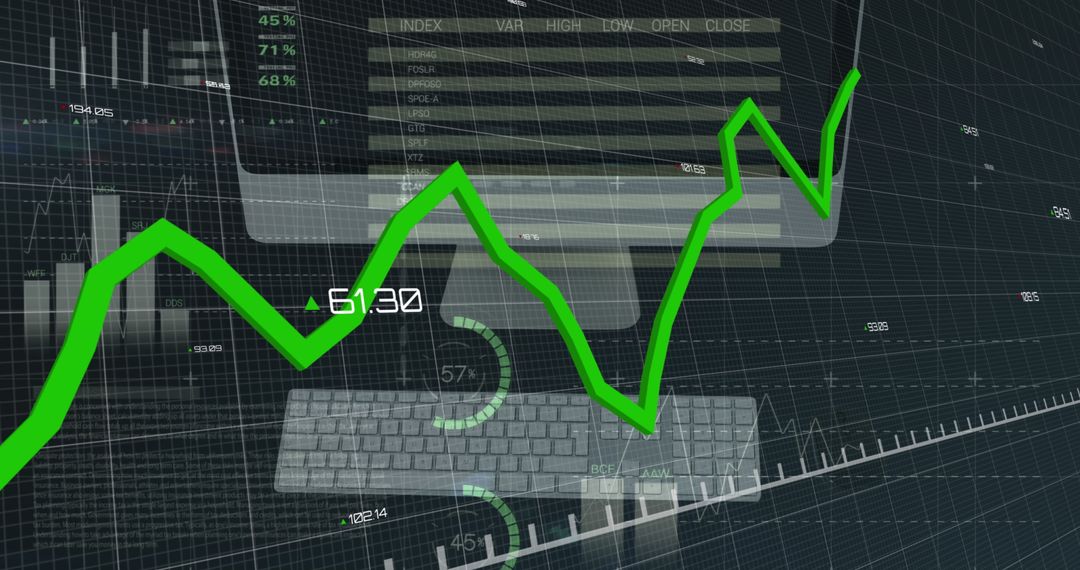
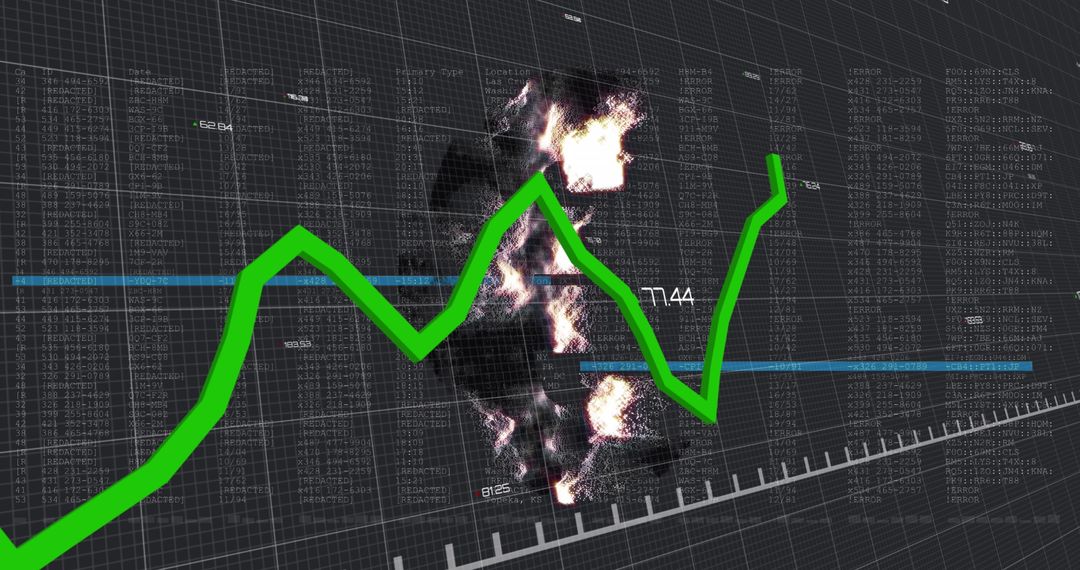
- Financial Data Graph with Rising Green Line and Analytics Dashboard
Financial Data Graph with Rising Green Line and Analytics Dashboard Image

Complex depiction of financial growth where green line symbolizes increasing profits or market uptick. Useful in presentations for market forecasting, fintech applications, or illustrating economic trends. Perfect for content focused on innovation in business analytics or highlighting success in investment endeavors.
Powered by  - Get 15% off with code: PIKWIZARD15


0
downloads
downloads
Tags:
More
Credit Photo
If you would like to credit the Photo, here are some ways you can do so
Text Link
photo Link
<span class="text-link">
<span>
<a target="_blank" href=https://pikwizard.com/photo/financial-data-graph-with-rising-green-line-and-analytics-dashboard/f573fa7993bbf92810d7456a3bafbf33/>PikWizard</a>
</span>
</span>
<span class="image-link">
<span
style="margin: 0 0 20px 0; display: inline-block; vertical-align: middle; width: 100%;"
>
<a
target="_blank"
href="https://pikwizard.com/photo/financial-data-graph-with-rising-green-line-and-analytics-dashboard/f573fa7993bbf92810d7456a3bafbf33/"
style="text-decoration: none; font-size: 10px; margin: 0;"
>
<img src="https://pikwizard.com/pw/medium/f573fa7993bbf92810d7456a3bafbf33.jpg" style="margin: 0; width: 100%;" alt="" />
<p style="font-size: 12px; margin: 0;">PikWizard</p>
</a>
</span>
</span>
Free (free of charge)
Free for personal and commercial use.
Author: Authentic Images
Similar Free Stock Images

Premium


Premium


Premium


Premium


Premium


Premium


Premium


Premium


Premium


Premium


Premium


Premium


Premium


Premium


Premium


Premium


Premium


Premium


Premium


Premium


Premium


Premium


Premium


Premium

