
- Home >
- Stock Photos >
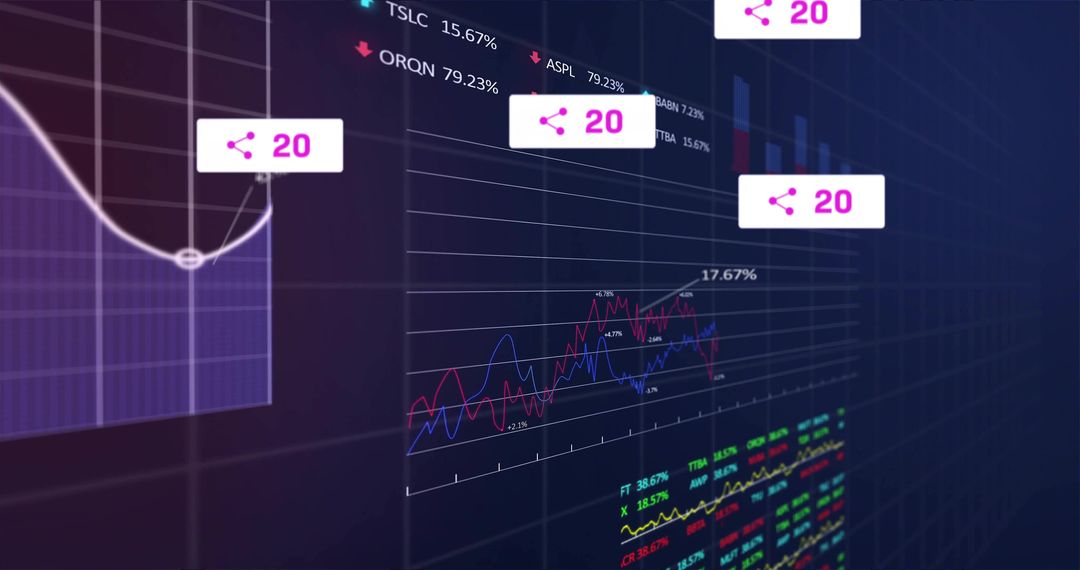
- Financial Data Graphic with Rising Trends on Digital Grid
Financial Data Graphic with Rising Trends on Digital Grid Image

Digitally generated graph displaying financial data on a grid background with growth and trend markers. Detail highlights fluctuations and percentages accentuate upward momentum. Ideal for presentations about financial analysis, stock market behavior, and business forecasts. Suitable for illustrating themes of digital finance, market research, and technological investment opportunities.
Powered by 


2
downloads
downloads
Tags:
More
Credit Photo
If you would like to credit the Photo, here are some ways you can do so
Text Link
photo Link
<span class="text-link">
<span>
<a target="_blank" href=https://pikwizard.com/photo/financial-data-graphic-with-rising-trends-on-digital-grid/7f78d8a4d574bfa153c67ccc459fe2ce/>PikWizard</a>
</span>
</span>
<span class="image-link">
<span
style="margin: 0 0 20px 0; display: inline-block; vertical-align: middle; width: 100%;"
>
<a
target="_blank"
href="https://pikwizard.com/photo/financial-data-graphic-with-rising-trends-on-digital-grid/7f78d8a4d574bfa153c67ccc459fe2ce/"
style="text-decoration: none; font-size: 10px; margin: 0;"
>
<img src="https://pikwizard.com/pw/medium/7f78d8a4d574bfa153c67ccc459fe2ce.jpg" style="margin: 0; width: 100%;" alt="" />
<p style="font-size: 12px; margin: 0;">PikWizard</p>
</a>
</span>
</span>
Free (free of charge)
Free for personal and commercial use.
Author: People Creations
Similar Free Stock Images

Premium


Premium


Premium


Premium


Premium


Premium


Premium


Premium


Premium


Premium


Premium


Premium


Premium


Premium


Premium


Premium


Premium


Premium


Premium


Premium


Premium


Premium


Premium


Premium

