- Home >
- Stock Photos >
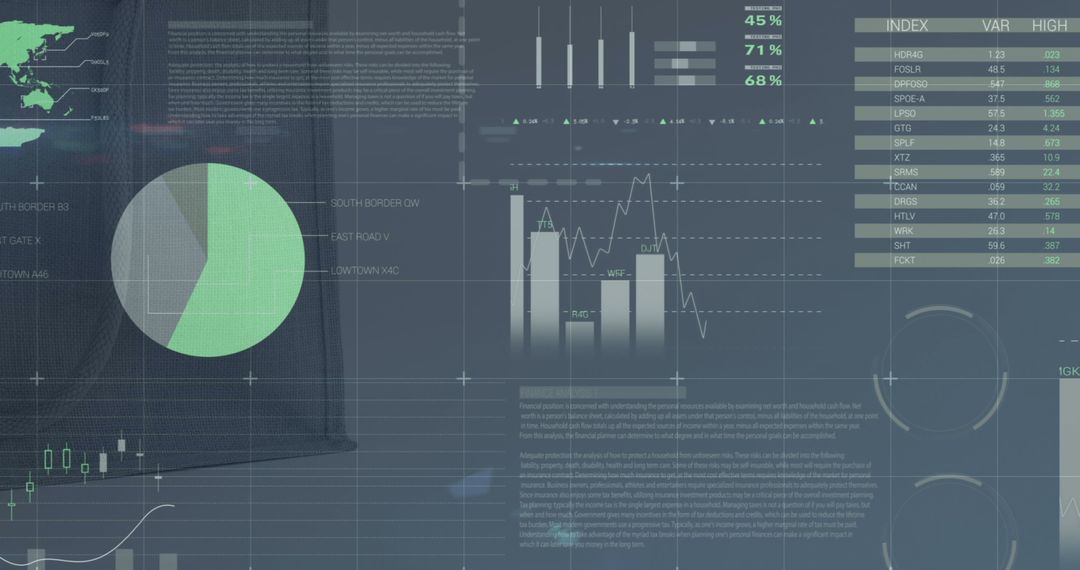
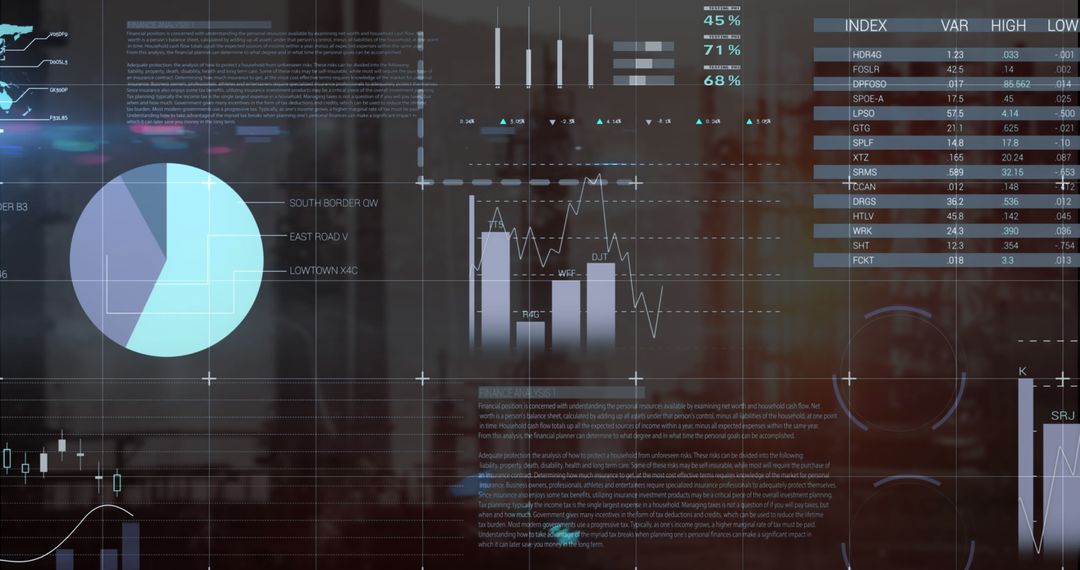
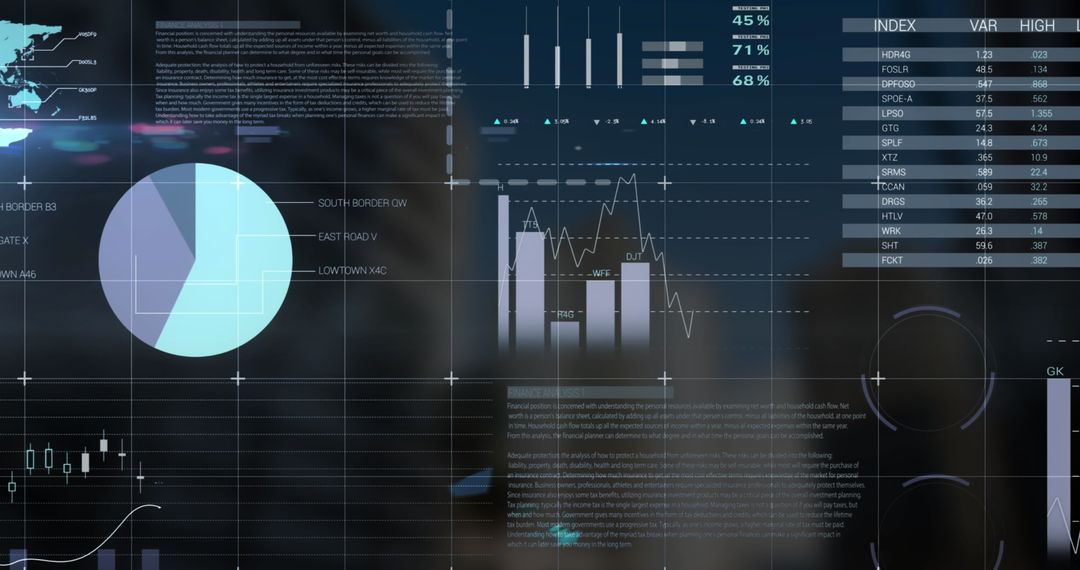
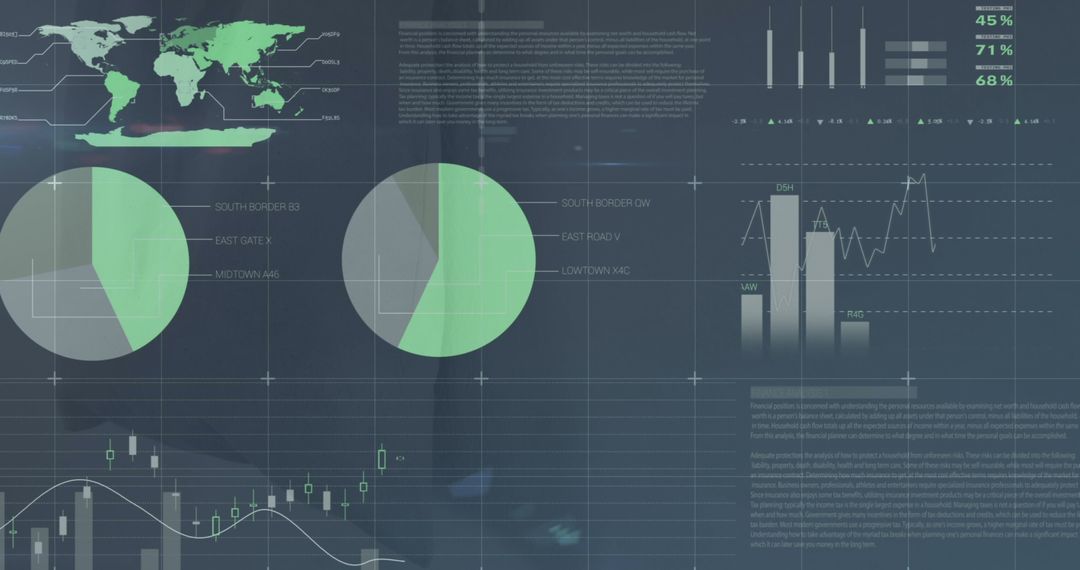
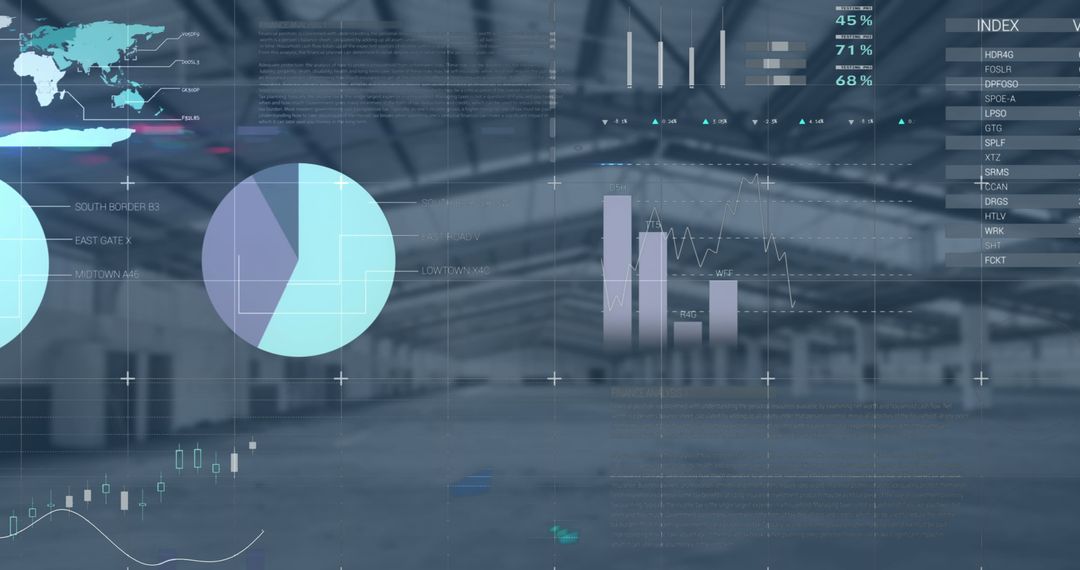
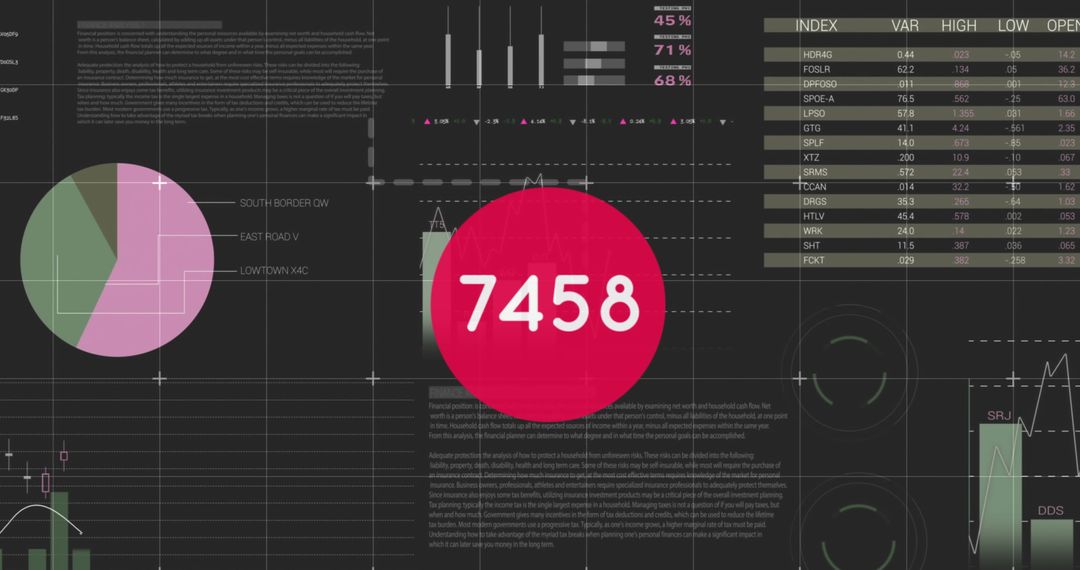
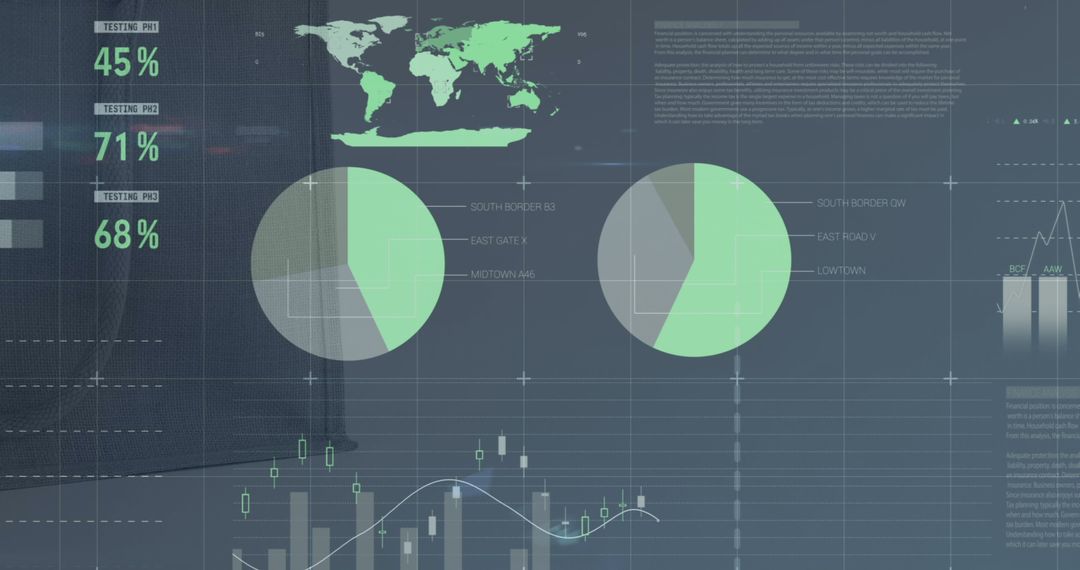
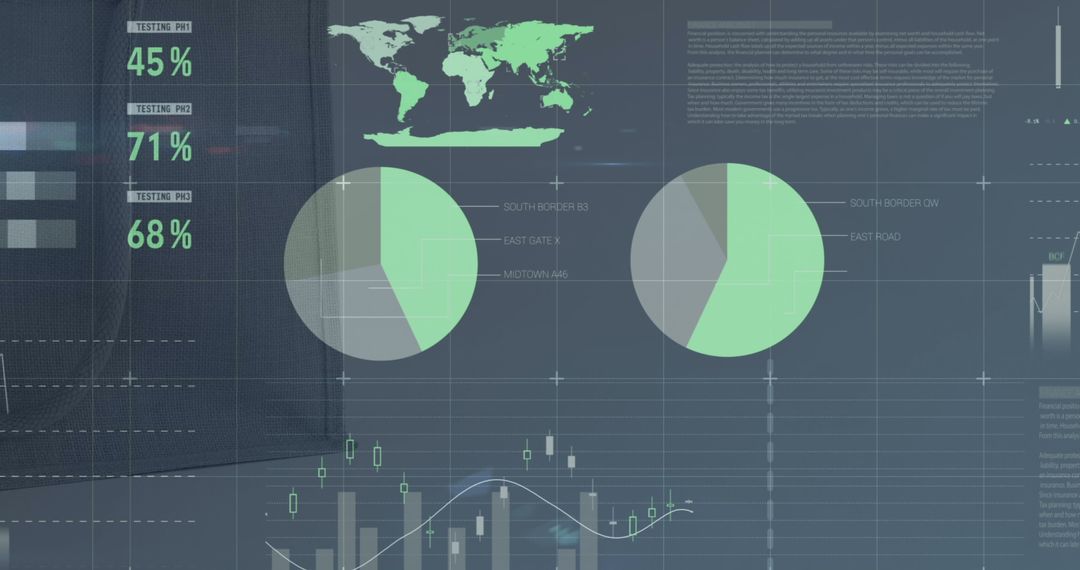
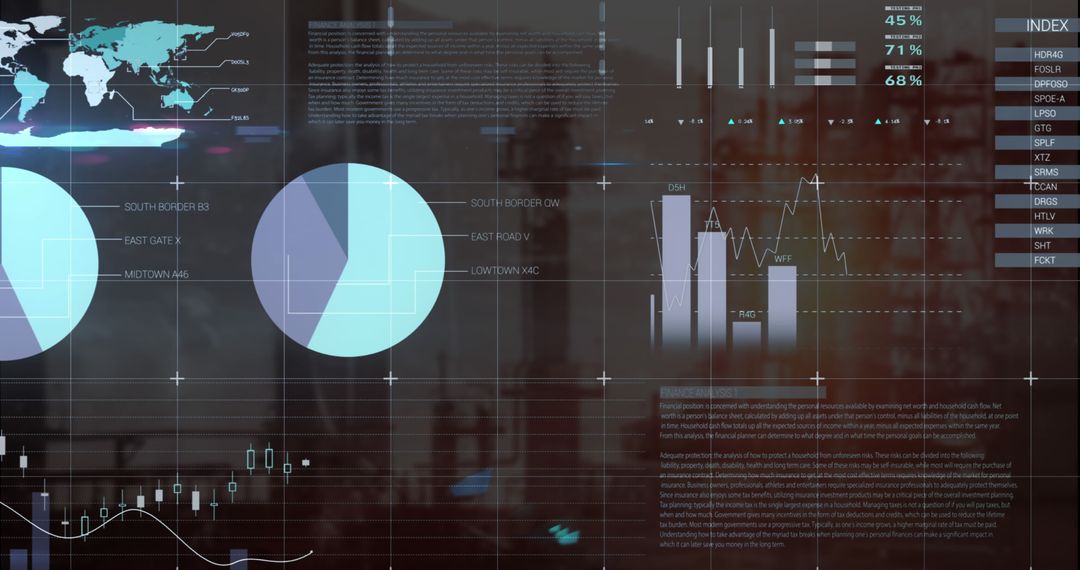
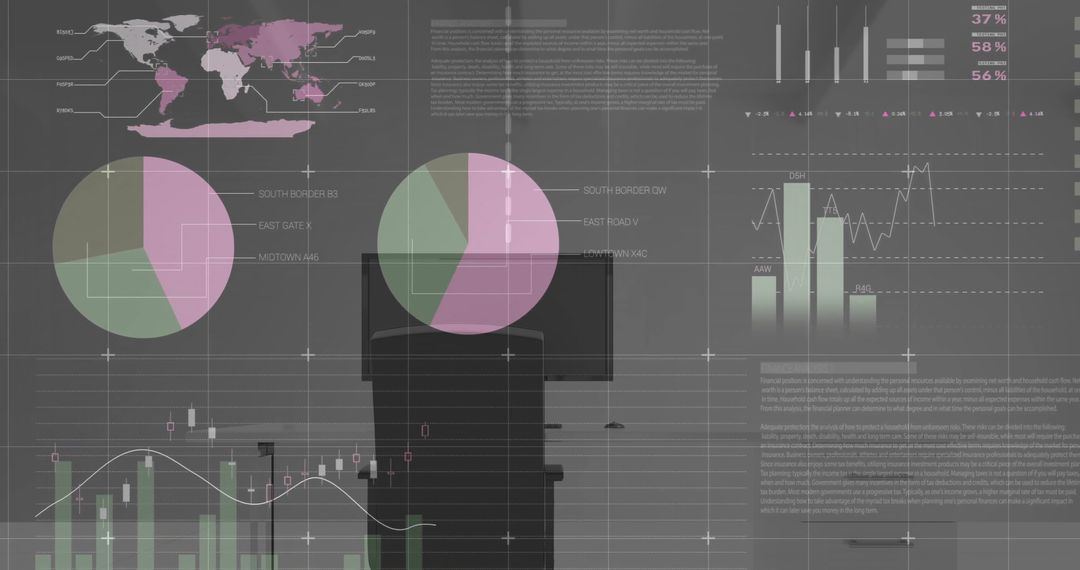
- Financial Data Graphics Overlay in Warehouse Environment
Financial Data Graphics Overlay in Warehouse Environment Image
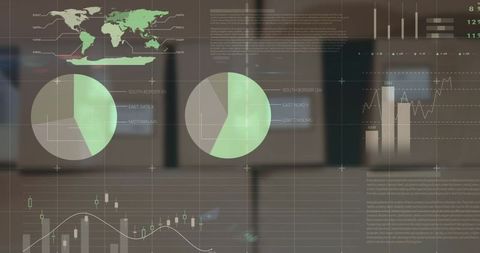
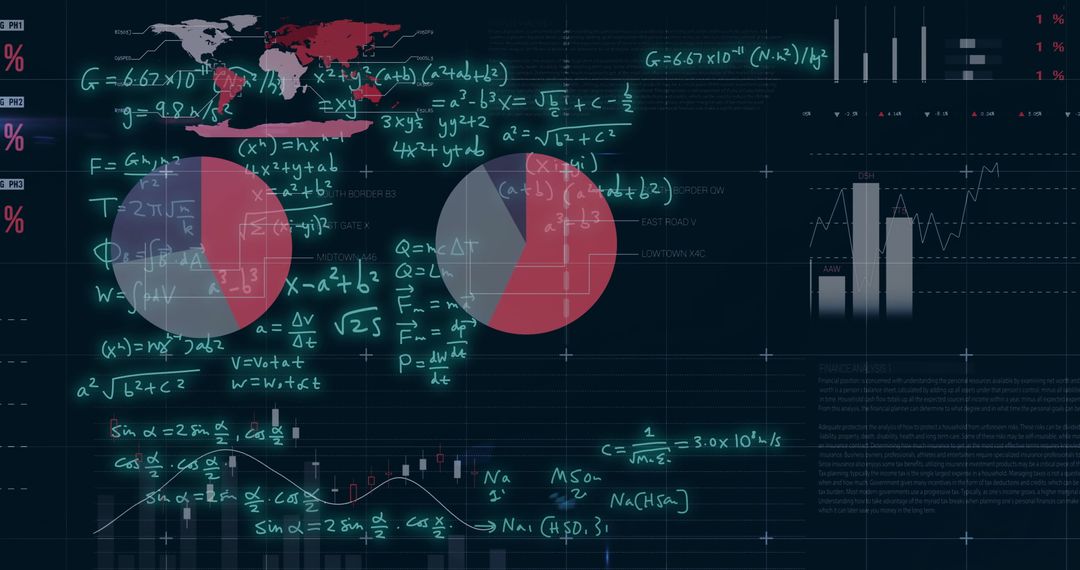
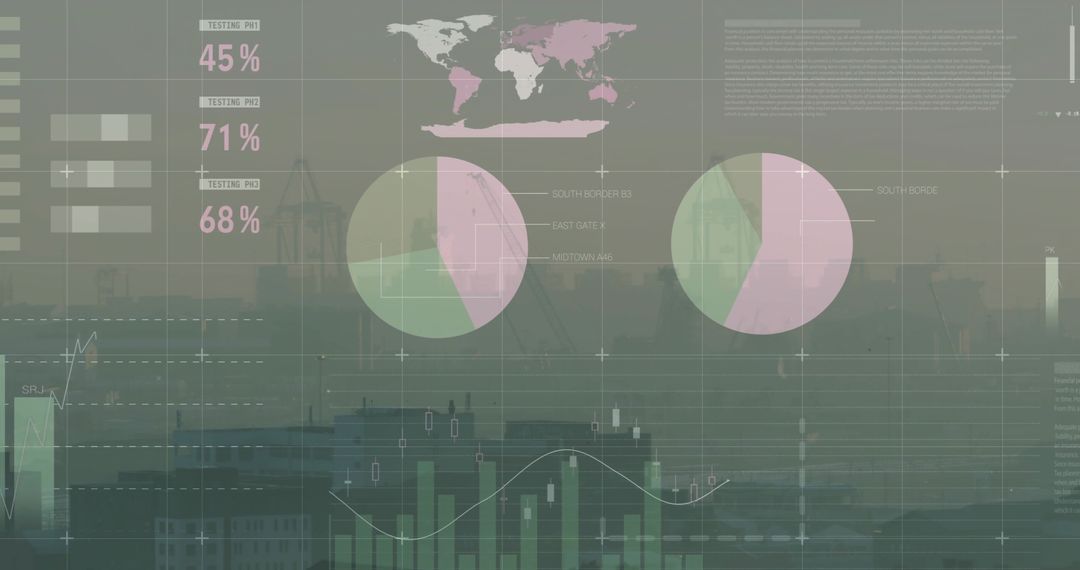
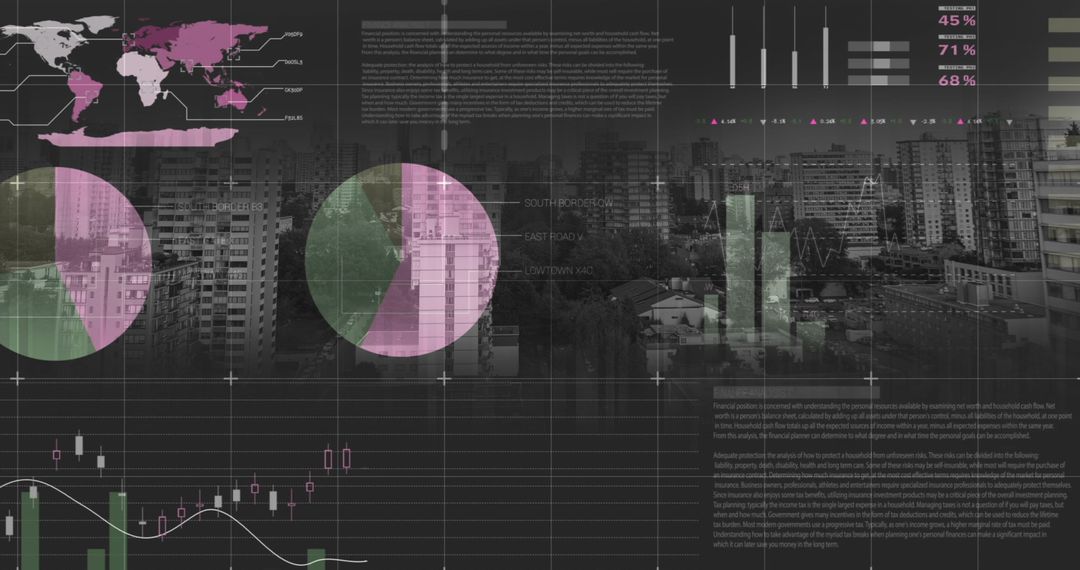
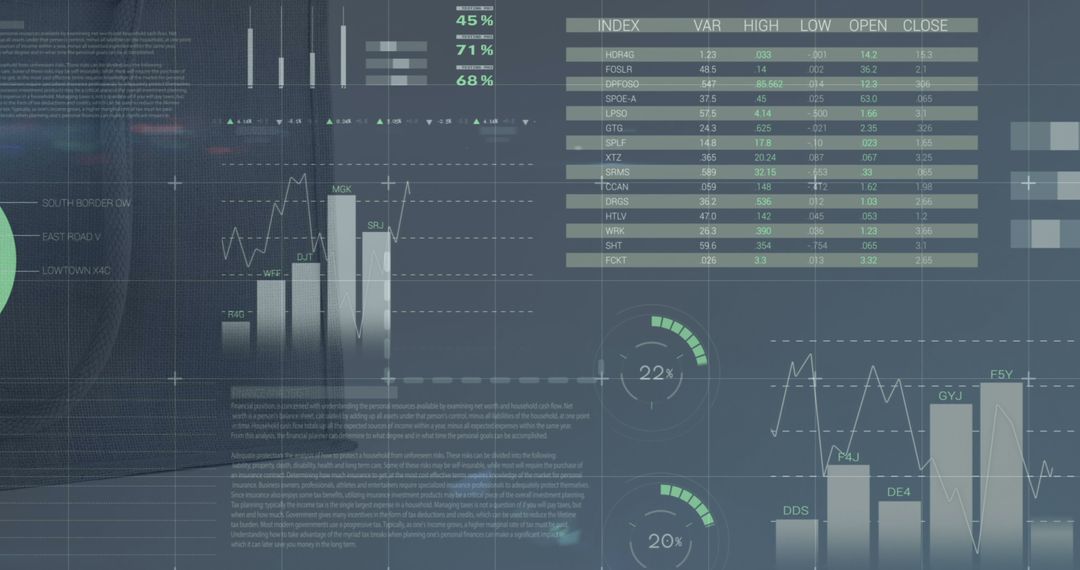
Image showing overlay of financial graphs and data visualization against background of packages in a warehouse, used for concepts of logistics, trade analysis, economic trends, and delivery service technology advancements. Ideal for illustrating topics related to economic data monitoring, logistics technology, and digital transformation in supply chains.
Powered by  - Get 15% off with code: PIKWIZARD15


4
downloads
downloads
Tags:
More
Credit Photo
If you would like to credit the Photo, here are some ways you can do so
Text Link
photo Link
<span class="text-link">
<span>
<a target="_blank" href=https://pikwizard.com/photo/financial-data-graphics-overlay-in-warehouse-environment/db1a0b895dae27719298478151e7647a/>PikWizard</a>
</span>
</span>
<span class="image-link">
<span
style="margin: 0 0 20px 0; display: inline-block; vertical-align: middle; width: 100%;"
>
<a
target="_blank"
href="https://pikwizard.com/photo/financial-data-graphics-overlay-in-warehouse-environment/db1a0b895dae27719298478151e7647a/"
style="text-decoration: none; font-size: 10px; margin: 0;"
>
<img src="https://pikwizard.com/pw/medium/db1a0b895dae27719298478151e7647a.jpg" style="margin: 0; width: 100%;" alt="" />
<p style="font-size: 12px; margin: 0;">PikWizard</p>
</a>
</span>
</span>
Free (free of charge)
Free for personal and commercial use.
Author: Authentic Images
Similar Free Stock Images

Premium


Premium


Premium


Premium


Premium


Premium


Premium


Premium


Premium


Premium


Premium


Premium


Premium


Premium

Premium


Premium


Premium


Premium


Premium


Premium


Premium


Premium


Premium


Premium