- Home >
- Stock Photos >
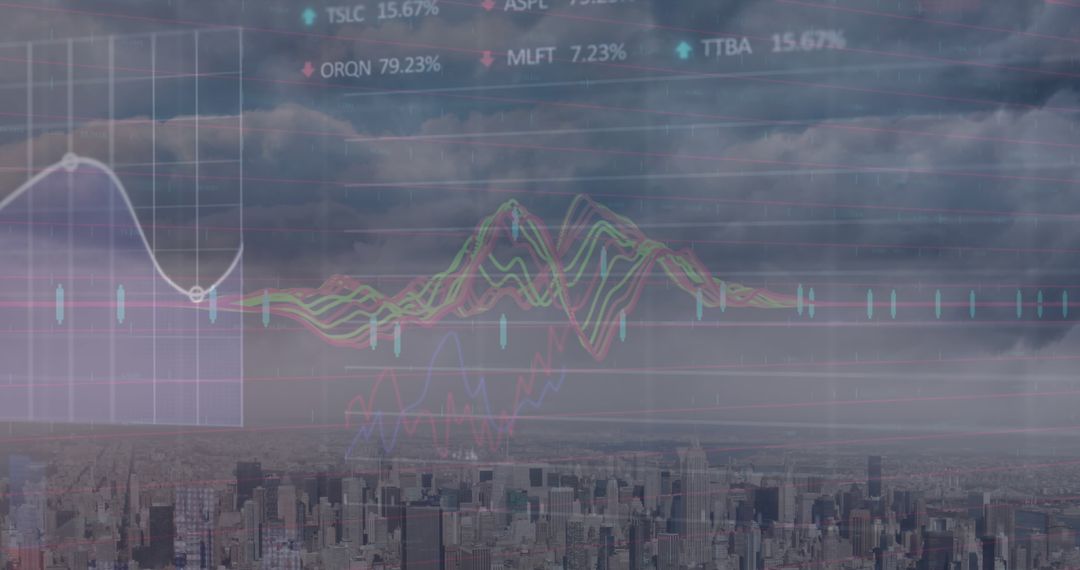
- Financial Data Graphs Overlaying Urban Skyline
Financial Data Graphs Overlaying Urban Skyline Image

This illustration shows financial data graphs overlaying an urban skyline, symbolizing the integration of global business trends within city dynamics. Useful for depicting concepts of financial analysis, market forecasts, and urban business growth, it can support themes related to technology in finance or urban economic development for reports, presentations, and digital content like websites or marketing materials.
Powered by  - Get 15% off with code: PIKWIZARD15


2
downloads
downloads
Tags:
More
Credit Photo
If you would like to credit the Photo, here are some ways you can do so
Text Link
photo Link
<span class="text-link">
<span>
<a target="_blank" href=https://pikwizard.com/photo/financial-data-graphs-overlaying-urban-skyline/53cfc41f6fc2059db78b5563c9e81b6e/>PikWizard</a>
</span>
</span>
<span class="image-link">
<span
style="margin: 0 0 20px 0; display: inline-block; vertical-align: middle; width: 100%;"
>
<a
target="_blank"
href="https://pikwizard.com/photo/financial-data-graphs-overlaying-urban-skyline/53cfc41f6fc2059db78b5563c9e81b6e/"
style="text-decoration: none; font-size: 10px; margin: 0;"
>
<img src="https://pikwizard.com/pw/medium/53cfc41f6fc2059db78b5563c9e81b6e.jpg" style="margin: 0; width: 100%;" alt="" />
<p style="font-size: 12px; margin: 0;">PikWizard</p>
</a>
</span>
</span>
Free (free of charge)
Free for personal and commercial use.
Author: People Creations
Similar Free Stock Images

Premium


Premium


Premium


Premium


Premium


Premium


Premium


Premium


Premium


Premium


Premium


Premium


Premium


Premium


Premium


Premium


Premium


Premium


Premium


Premium


Premium


Premium


Premium


Premium