- Home >
- Stock Photos >
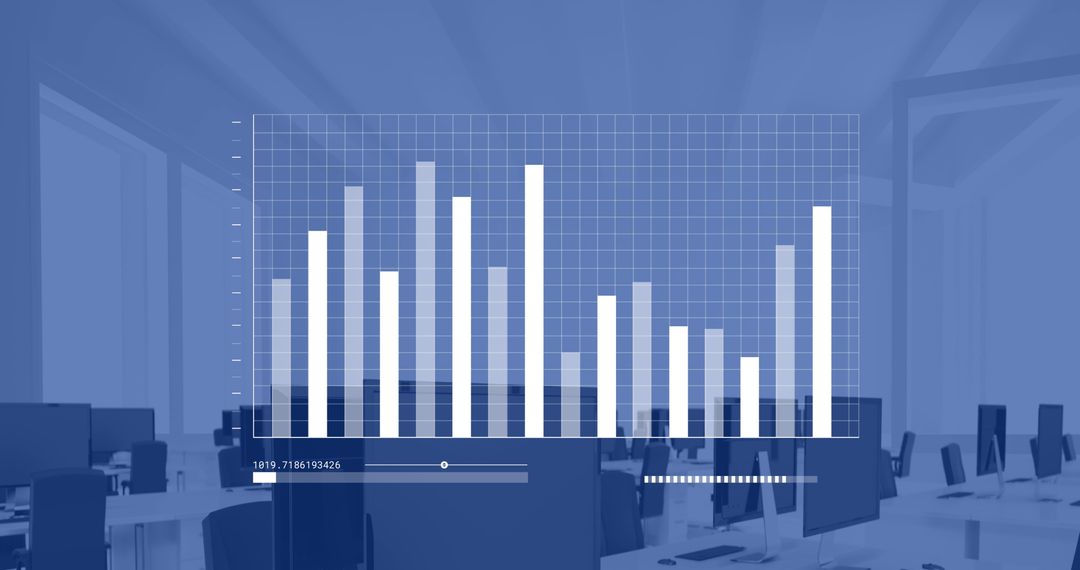
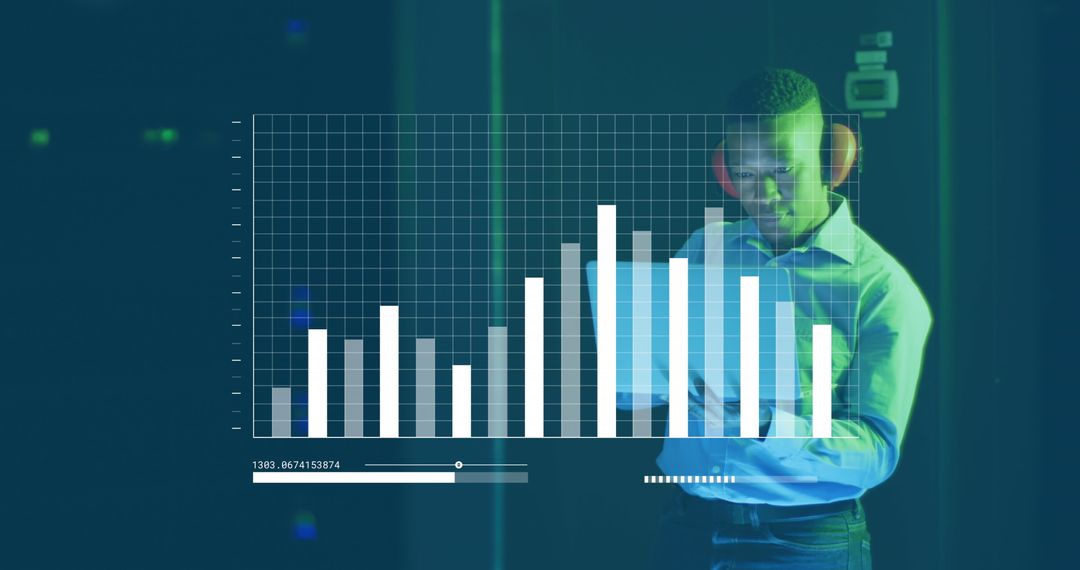
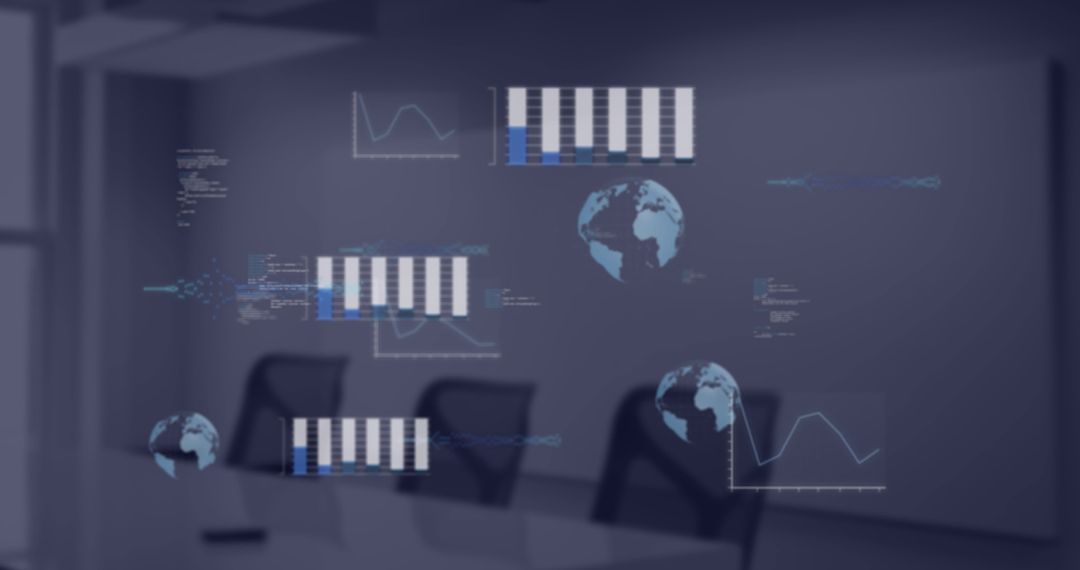
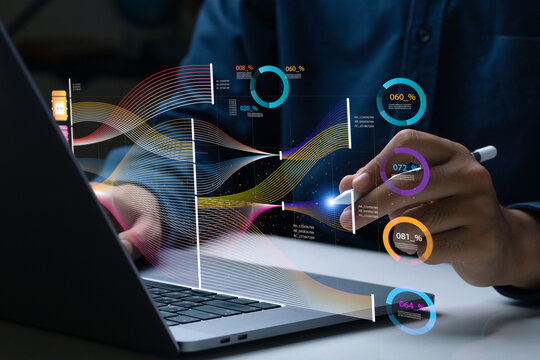
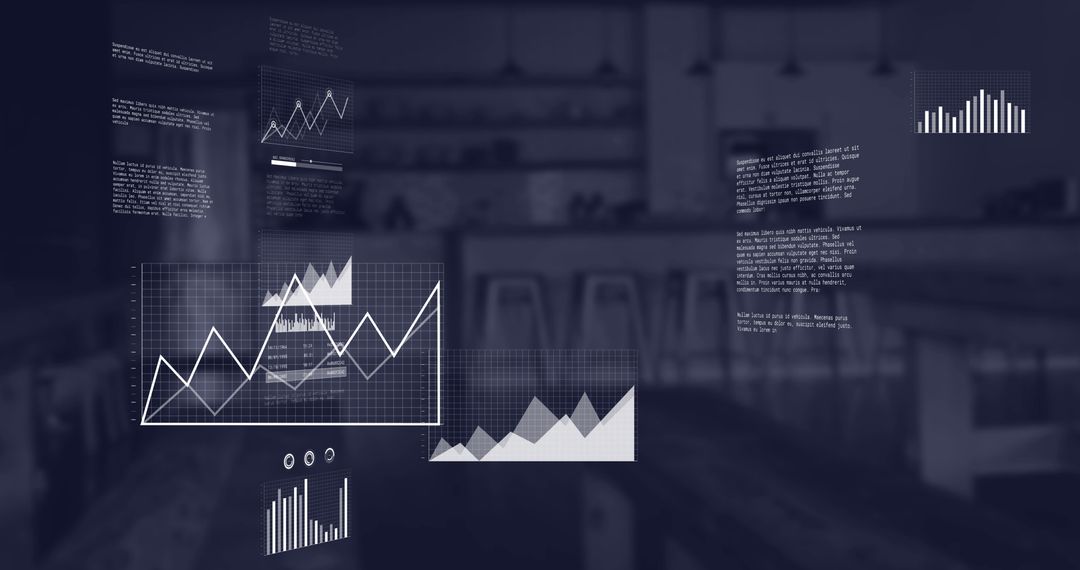
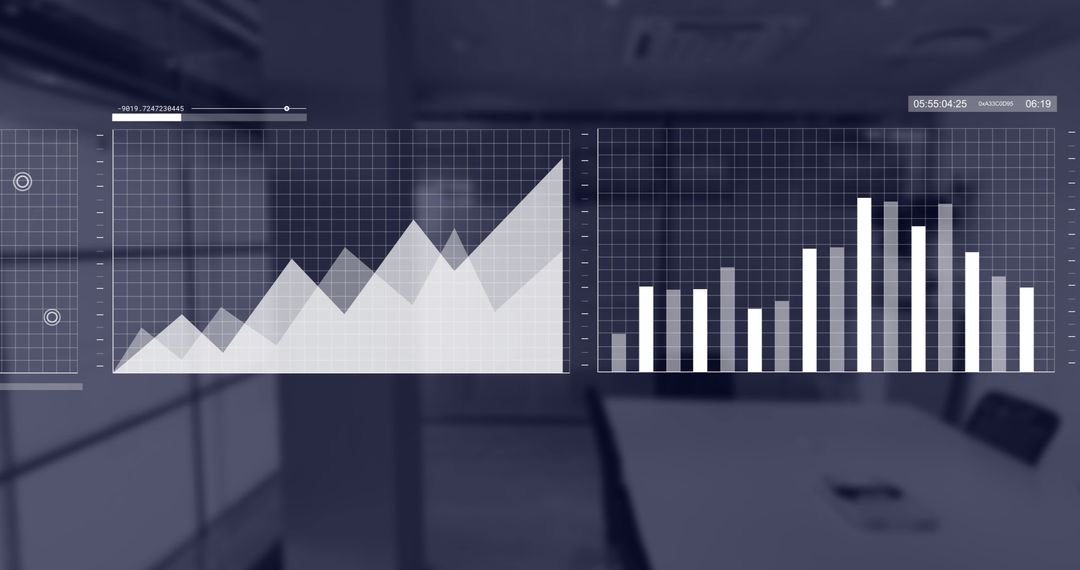
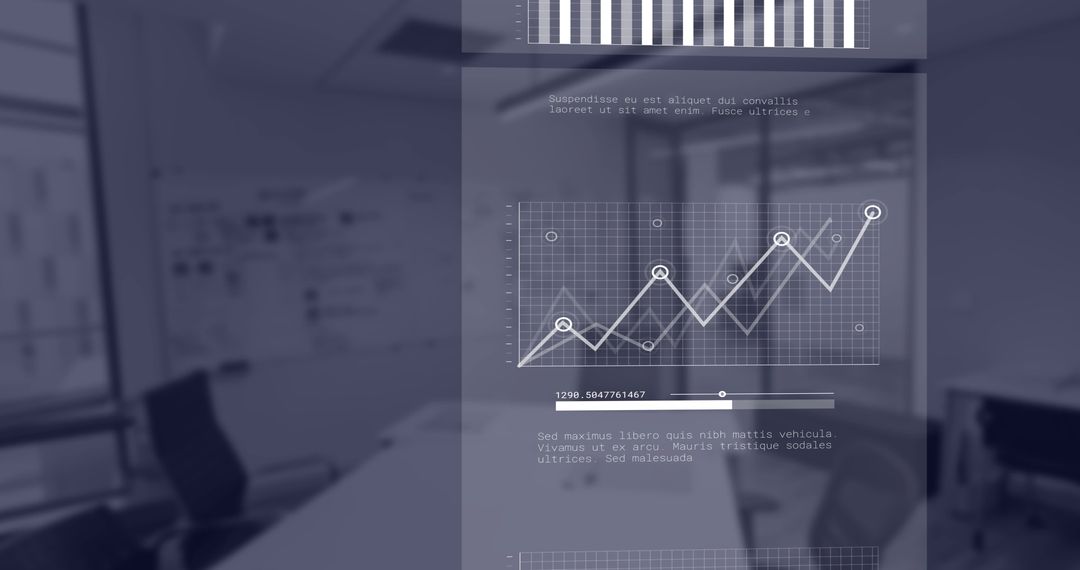
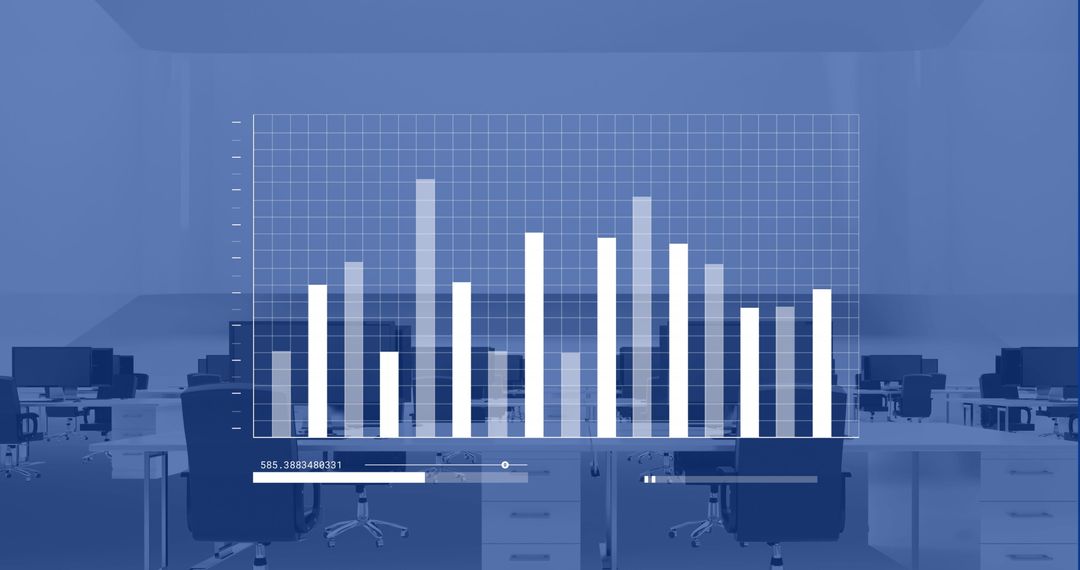
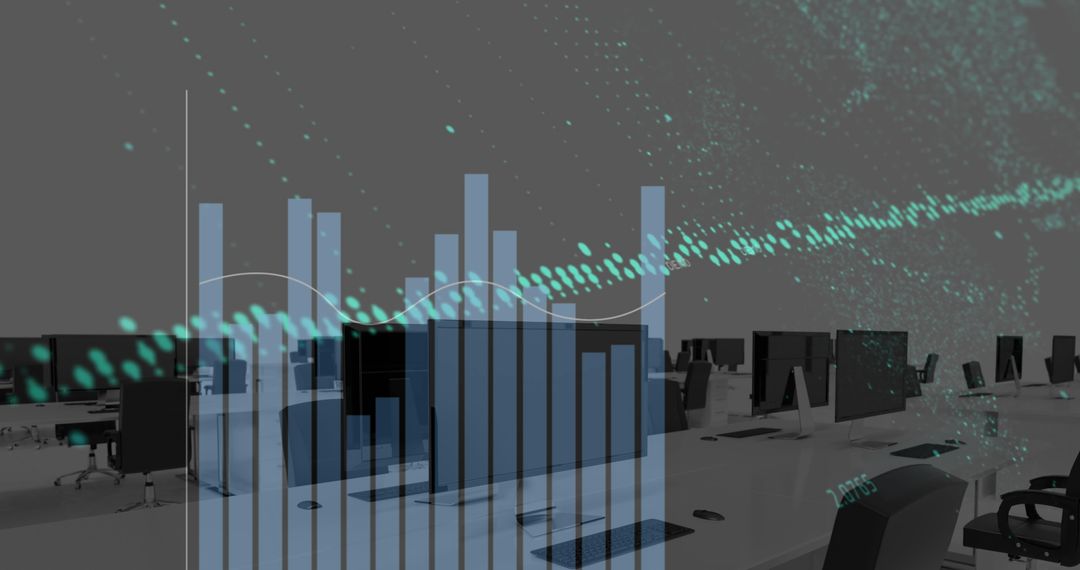
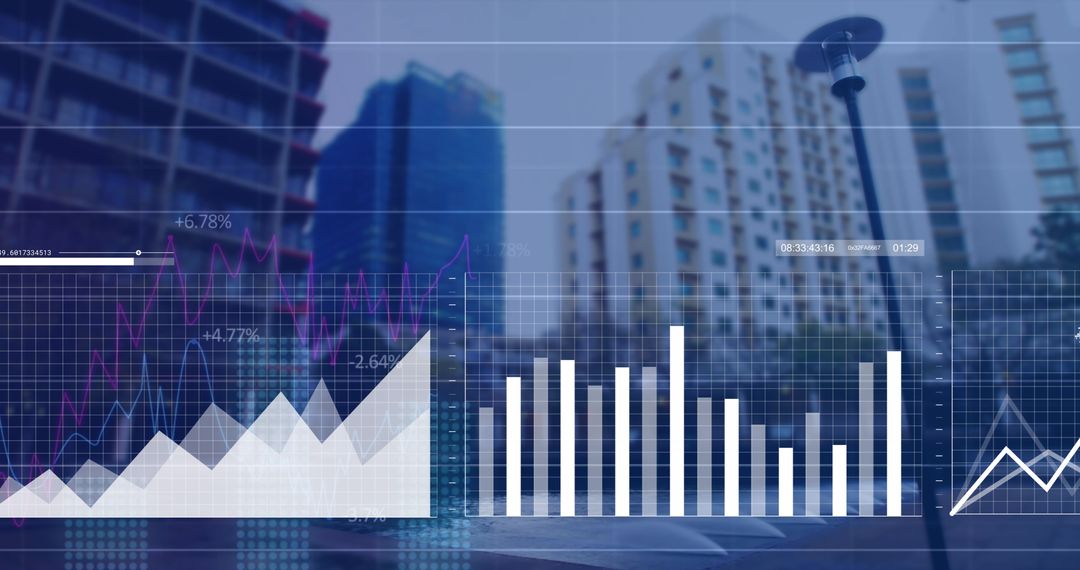
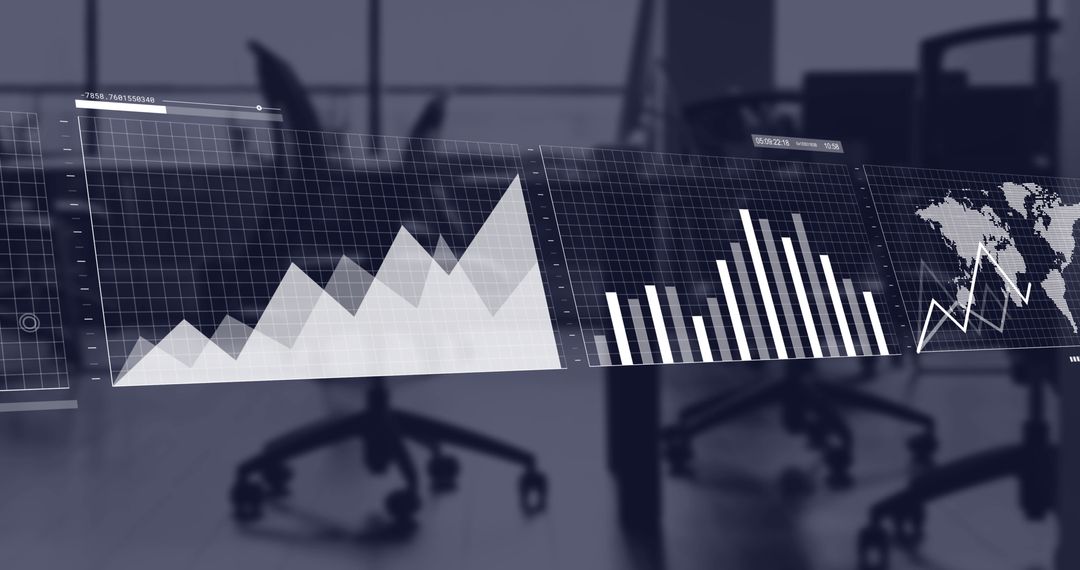
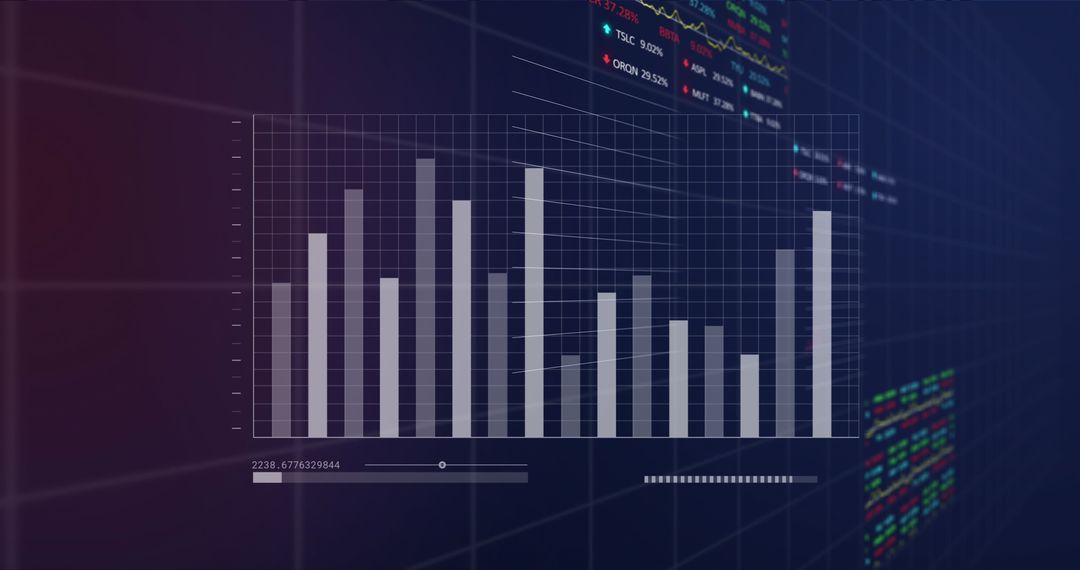
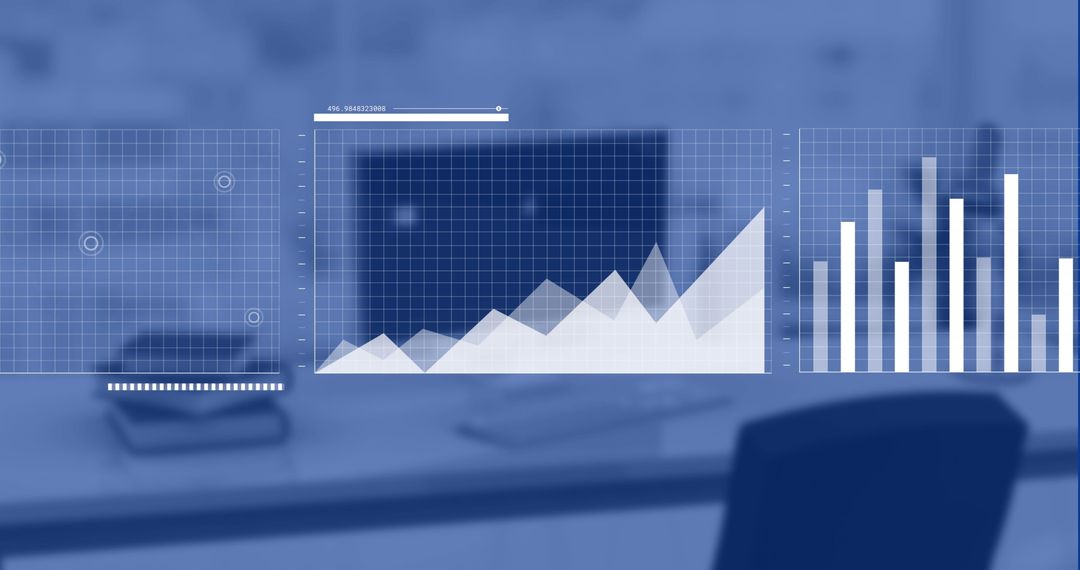
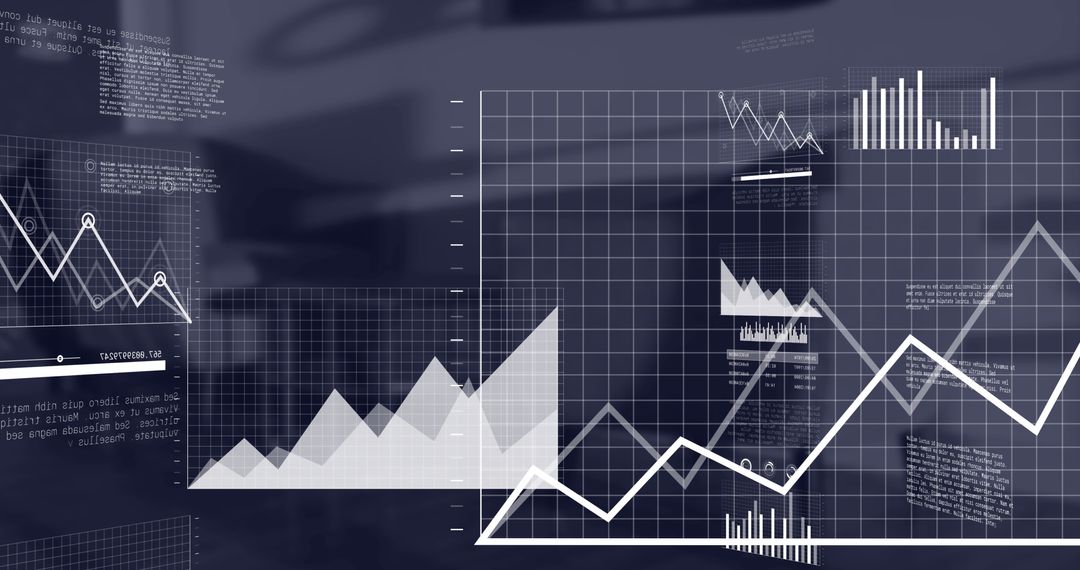
- Financial Data on Office Desk with Digital Charts
Financial Data on Office Desk with Digital Charts Image

Digital charts overlay scene showing data analytics and business insights on office desk background. Useful for illustrating concepts related to financial analysis, global business strategies, technology in finance, and data-driven decision making.
Powered by 


2
downloads
downloads
Tags:
More
Credit Photo
If you would like to credit the Photo, here are some ways you can do so
Text Link
photo Link
<span class="text-link">
<span>
<a target="_blank" href=https://pikwizard.com/photo/financial-data-on-office-desk-with-digital-charts/92e33a5f2eeae9d6b92df1f987385513/>PikWizard</a>
</span>
</span>
<span class="image-link">
<span
style="margin: 0 0 20px 0; display: inline-block; vertical-align: middle; width: 100%;"
>
<a
target="_blank"
href="https://pikwizard.com/photo/financial-data-on-office-desk-with-digital-charts/92e33a5f2eeae9d6b92df1f987385513/"
style="text-decoration: none; font-size: 10px; margin: 0;"
>
<img src="https://pikwizard.com/pw/medium/92e33a5f2eeae9d6b92df1f987385513.jpg" style="margin: 0; width: 100%;" alt="" />
<p style="font-size: 12px; margin: 0;">PikWizard</p>
</a>
</span>
</span>
Free (free of charge)
Free for personal and commercial use.
Author: Creative Art
Similar Free Stock Images

Premium


Premium

Premium


Premium


Premium


Premium


Premium


Premium


Premium


Premium


Premium


Premium


Premium


Premium

Premium


Premium


Premium


Premium


Premium


Premium


Premium


Premium


Premium


Premium