- Home >
- Stock Photos >
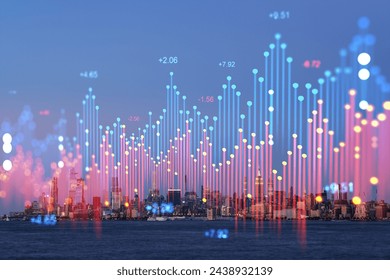
- Financial Data Overlay on Cityscape Visualizing Market Trends
Financial Data Overlay on Cityscape Visualizing Market Trends Image

Vibrant visual of glowing financial data and graphs superimposed over a city skyline, symbolizing global economic activity and trends. The lively graphical elements against the city outline represent market fluctuations and movements. Suitable for use in finance-related websites, business presentations, and educational resources about global markets and investments.
Powered by  - Get 15% off with code: PIKWIZARD15


4
downloads
downloads
Tags:
More
Credit Photo
If you would like to credit the Photo, here are some ways you can do so
Text Link
photo Link
<span class="text-link">
<span>
<a target="_blank" href=https://pikwizard.com/photo/financial-data-overlay-on-cityscape-visualizing-market-trends/522094d85b2c6a9f37ebb23c43f2270d/>PikWizard</a>
</span>
</span>
<span class="image-link">
<span
style="margin: 0 0 20px 0; display: inline-block; vertical-align: middle; width: 100%;"
>
<a
target="_blank"
href="https://pikwizard.com/photo/financial-data-overlay-on-cityscape-visualizing-market-trends/522094d85b2c6a9f37ebb23c43f2270d/"
style="text-decoration: none; font-size: 10px; margin: 0;"
>
<img src="https://pikwizard.com/pw/medium/522094d85b2c6a9f37ebb23c43f2270d.jpg" style="margin: 0; width: 100%;" alt="" />
<p style="font-size: 12px; margin: 0;">PikWizard</p>
</a>
</span>
</span>
Free (free of charge)
Free for personal and commercial use.
Author: People Creations
Similar Free Stock Images

Premium


Premium


Premium


Premium


Premium


Premium


Premium


Premium


Premium


Premium


Premium


Premium


Premium


Premium


Premium


Premium


Premium


Premium


Premium


Premium


Premium


Premium


Premium


Premium