
- Home >
- Stock Photos >
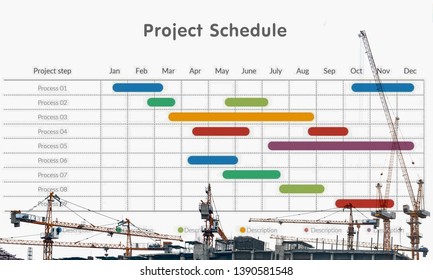
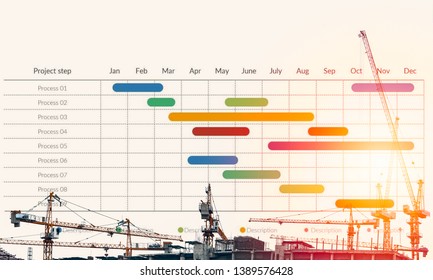
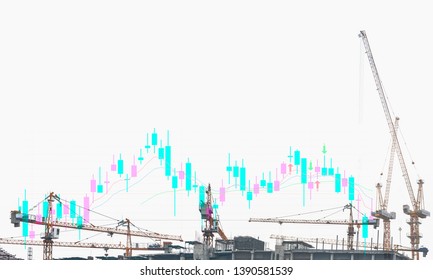
- Financial Data Overlay on Construction Site with Crane
Financial Data Overlay on Construction Site with Crane Image

Abstract visual of financial charts and graphs layered over a construction site featuring a crane, symbolizing the intersection of global economic trends and urban development. Useful for illustrating concepts related to financial market analysis, economic development, and the integration of technology in industry planning. It can be used in articles about global economy, market fluctuations, or in promotional materials for financial services and technology companies.
Powered by  - Get 15% off with code: PIKWIZARD15


2
downloads
downloads
Tags:
More
Credit Photo
If you would like to credit the Photo, here are some ways you can do so
Text Link
photo Link
<span class="text-link">
<span>
<a target="_blank" href=https://pikwizard.com/photo/financial-data-overlay-on-construction-site-with-crane/027b380a3503b0ed8efb2495af14b447/>PikWizard</a>
</span>
</span>
<span class="image-link">
<span
style="margin: 0 0 20px 0; display: inline-block; vertical-align: middle; width: 100%;"
>
<a
target="_blank"
href="https://pikwizard.com/photo/financial-data-overlay-on-construction-site-with-crane/027b380a3503b0ed8efb2495af14b447/"
style="text-decoration: none; font-size: 10px; margin: 0;"
>
<img src="https://pikwizard.com/pw/medium/027b380a3503b0ed8efb2495af14b447.jpg" style="margin: 0; width: 100%;" alt="" />
<p style="font-size: 12px; margin: 0;">PikWizard</p>
</a>
</span>
</span>
Free (free of charge)
Free for personal and commercial use.
Author: People Creations
Similar Free Stock Images

Premium


Premium


Premium


Premium


Premium


Premium


Premium


Premium


Premium


Premium


Premium


Premium


Premium


Premium


Premium


Premium


Premium


Premium


Premium


Premium


Premium


Premium


Premium


Premium


Premium

