- Home >
- Stock Photos >
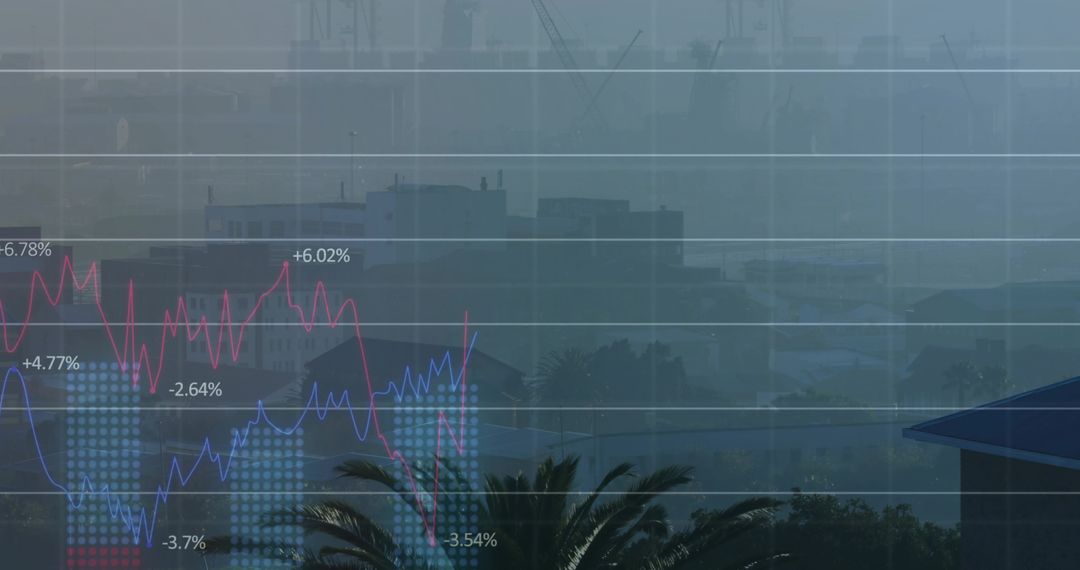
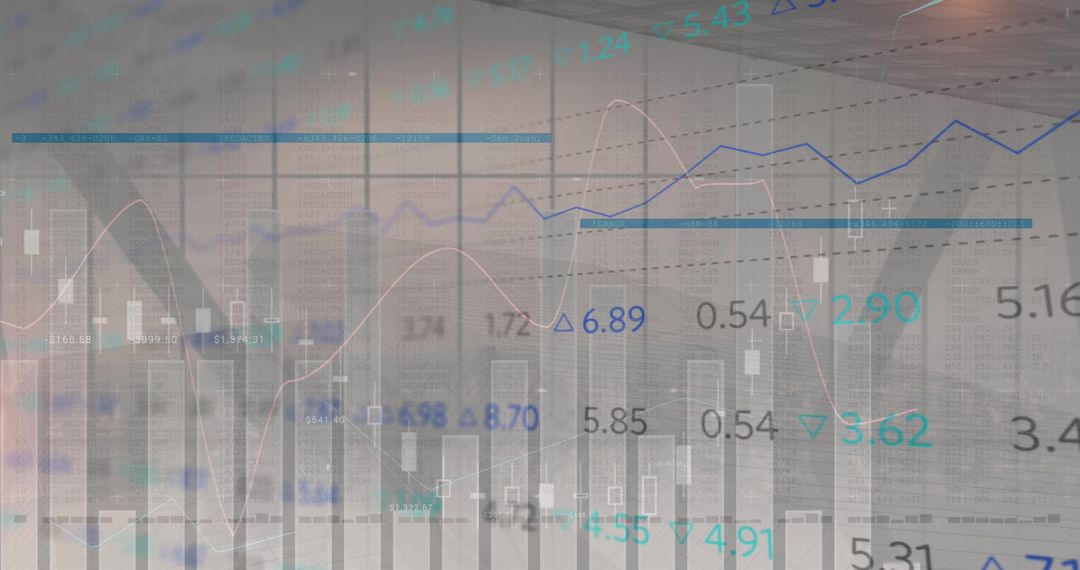
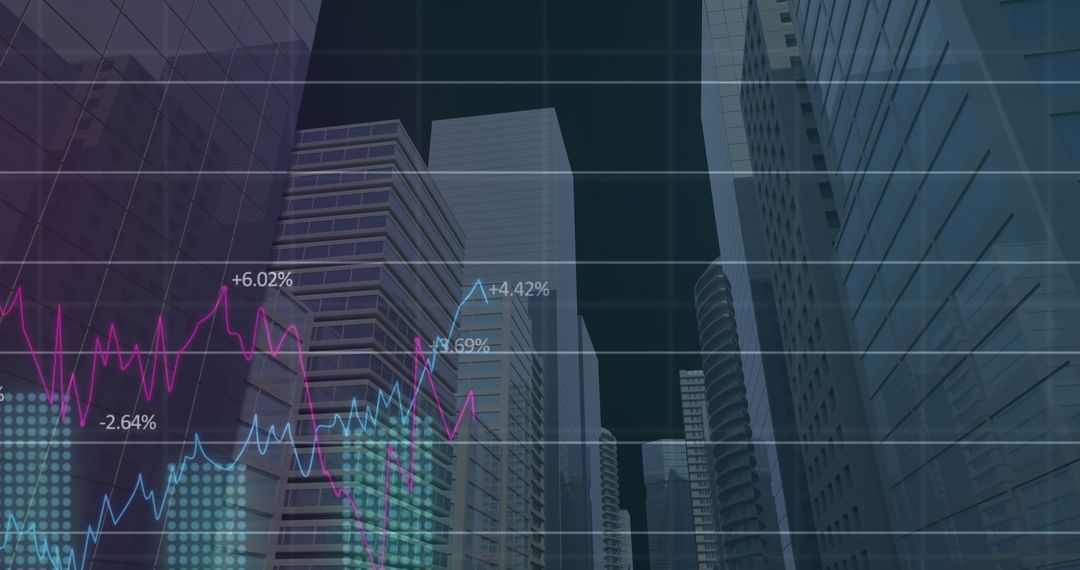
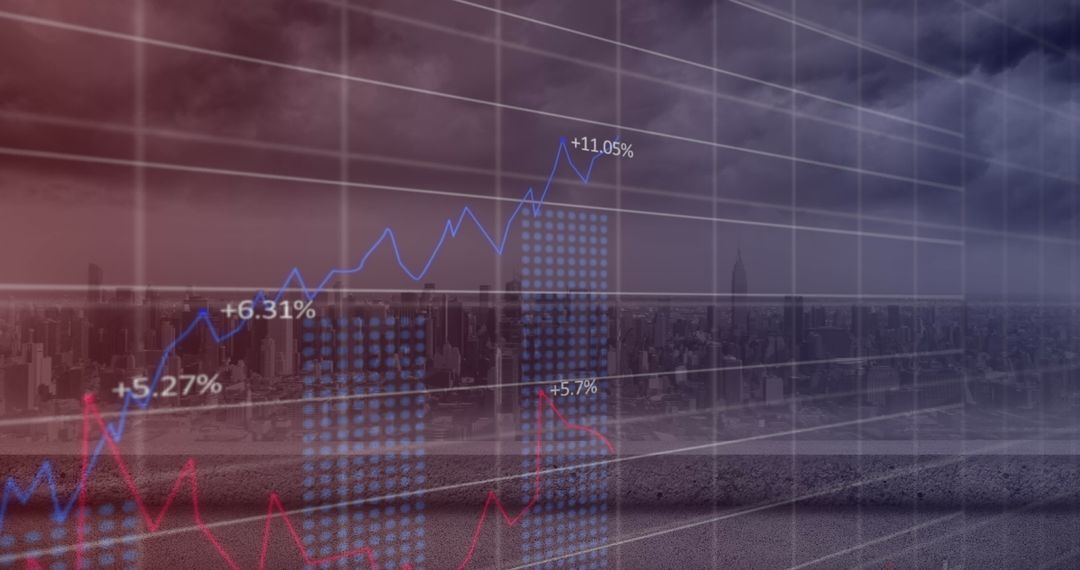
- Financial Data Overlay on Walking Business Professionals
Financial Data Overlay on Walking Business Professionals Image

Abstract concepts of financial data processing blend with blurred images of professionals walking, symbolizing intricate global connections and a fast-paced business environment. Intersecting charts represent market fluctuations and dynamic economic trends. Ideal for use in articles or blogs concerning finance industry insights, financial technology innovations, corporate strategy analysis, or market dynamics.
Powered by 


2
downloads
downloads
Tags:
More
Credit Photo
If you would like to credit the Photo, here are some ways you can do so
Text Link
photo Link
<span class="text-link">
<span>
<a target="_blank" href=https://pikwizard.com/photo/financial-data-overlay-on-walking-business-professionals/3ba5a5f81fd4f1b46b2862cb0dc41d5b/>PikWizard</a>
</span>
</span>
<span class="image-link">
<span
style="margin: 0 0 20px 0; display: inline-block; vertical-align: middle; width: 100%;"
>
<a
target="_blank"
href="https://pikwizard.com/photo/financial-data-overlay-on-walking-business-professionals/3ba5a5f81fd4f1b46b2862cb0dc41d5b/"
style="text-decoration: none; font-size: 10px; margin: 0;"
>
<img src="https://pikwizard.com/pw/medium/3ba5a5f81fd4f1b46b2862cb0dc41d5b.jpg" style="margin: 0; width: 100%;" alt="" />
<p style="font-size: 12px; margin: 0;">PikWizard</p>
</a>
</span>
</span>
Free (free of charge)
Free for personal and commercial use.
Author: Authentic Images
Similar Free Stock Images

Premium


Premium


Premium


Premium


Premium


Premium


Premium


Premium


Premium


Premium


Premium


Premium


Premium


Premium


Premium


Premium


Premium


Premium


Premium


Premium


Premium


Premium


Premium


Premium