- Home >
- Stock Photos >
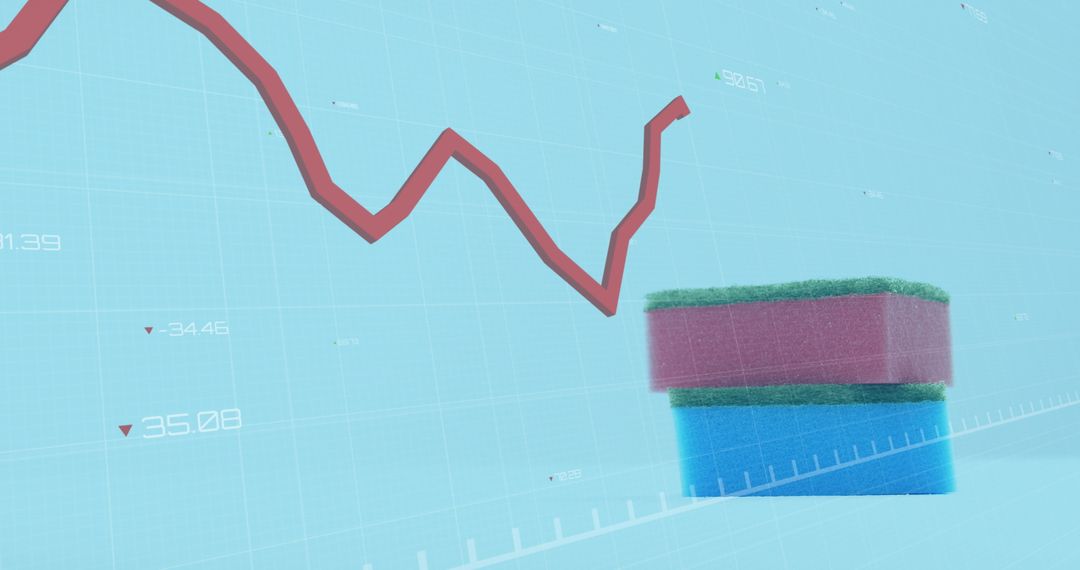
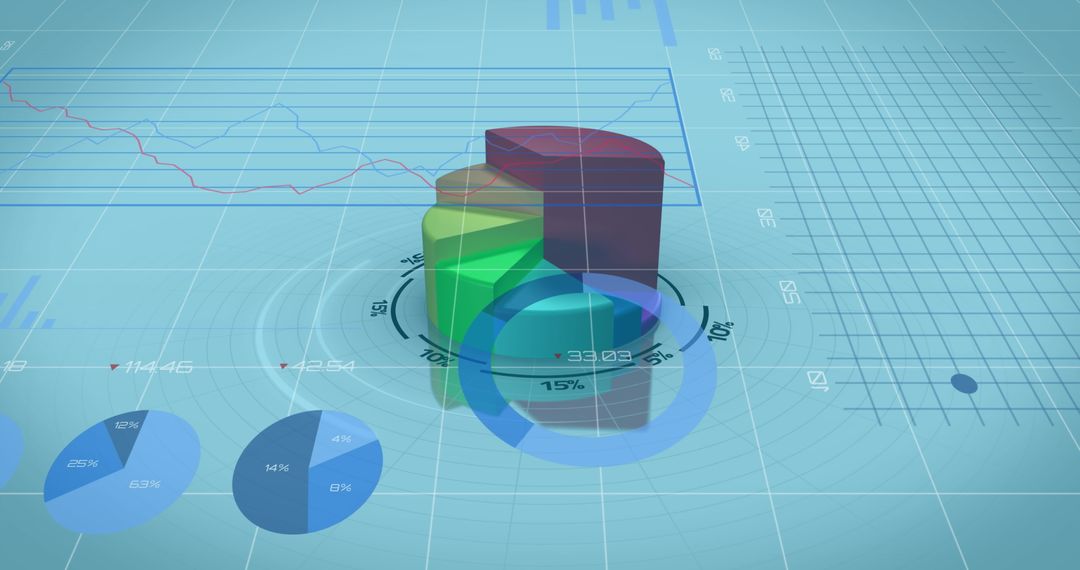
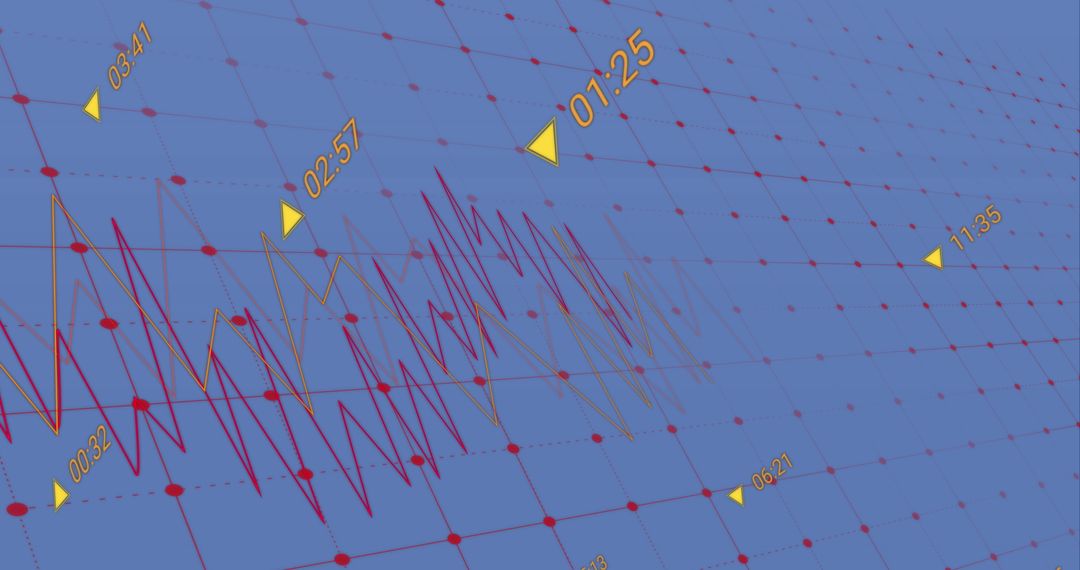
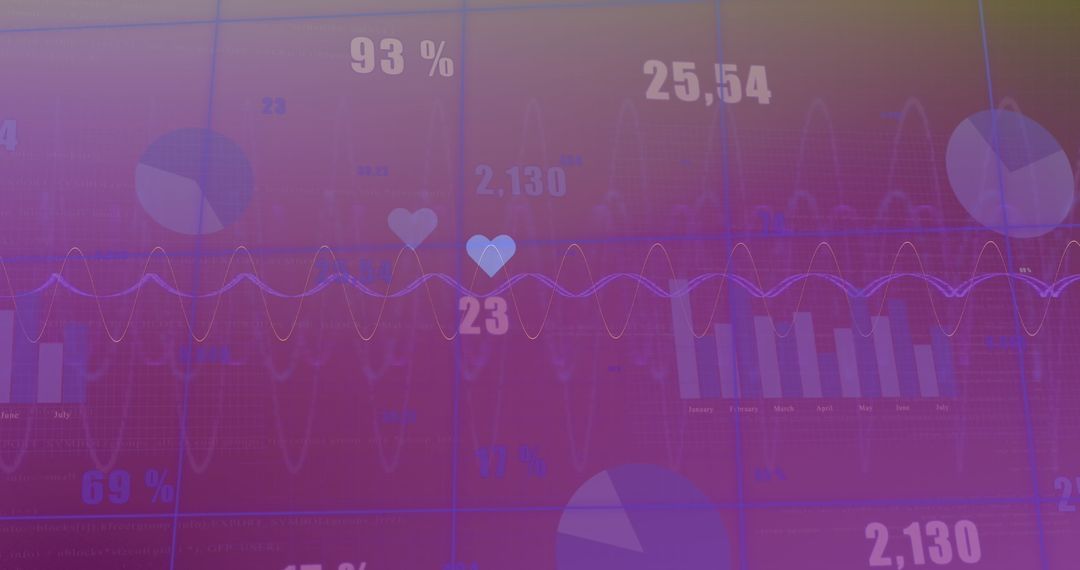
- Financial Data Overlay with Tangram Pieces on Blue Background
Financial Data Overlay with Tangram Pieces on Blue Background Image

This image combines abstract financial data displays with geometric shapes, set on a soothing blue background. The overlay of graphs and metrics depicted alongside the tangram shapes creatively represents financial analysis and economic trends. Use this concept art for illustrating financial reports, business slides, data-driven narratives, or articles focusing on market economics.
Powered by  - Get 15% off with code: PIKWIZARD15


2
downloads
downloads
Tags:
More
Credit Photo
If you would like to credit the Photo, here are some ways you can do so
Text Link
photo Link
<span class="text-link">
<span>
<a target="_blank" href=https://pikwizard.com/photo/financial-data-overlay-with-tangram-pieces-on-blue-background/b175f6f169340d0e432633b7f7fb49fa/>PikWizard</a>
</span>
</span>
<span class="image-link">
<span
style="margin: 0 0 20px 0; display: inline-block; vertical-align: middle; width: 100%;"
>
<a
target="_blank"
href="https://pikwizard.com/photo/financial-data-overlay-with-tangram-pieces-on-blue-background/b175f6f169340d0e432633b7f7fb49fa/"
style="text-decoration: none; font-size: 10px; margin: 0;"
>
<img src="https://pikwizard.com/pw/medium/b175f6f169340d0e432633b7f7fb49fa.jpg" style="margin: 0; width: 100%;" alt="" />
<p style="font-size: 12px; margin: 0;">PikWizard</p>
</a>
</span>
</span>
Free (free of charge)
Free for personal and commercial use.
Author: Awesome Content
Similar Free Stock Images
Premium


Premium


Premium


Premium


Premium


Premium


Premium


Premium


Premium


Premium


Premium


Premium


Premium


Premium


Premium


Premium


Premium


Premium


Premium


Premium


Premium


Premium


Premium


Premium