- Home >
- Stock Photos >
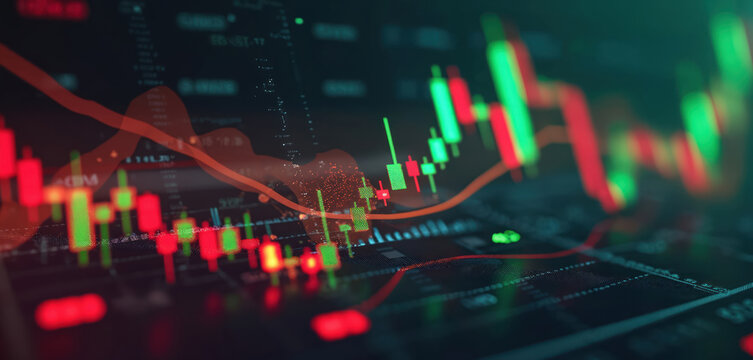
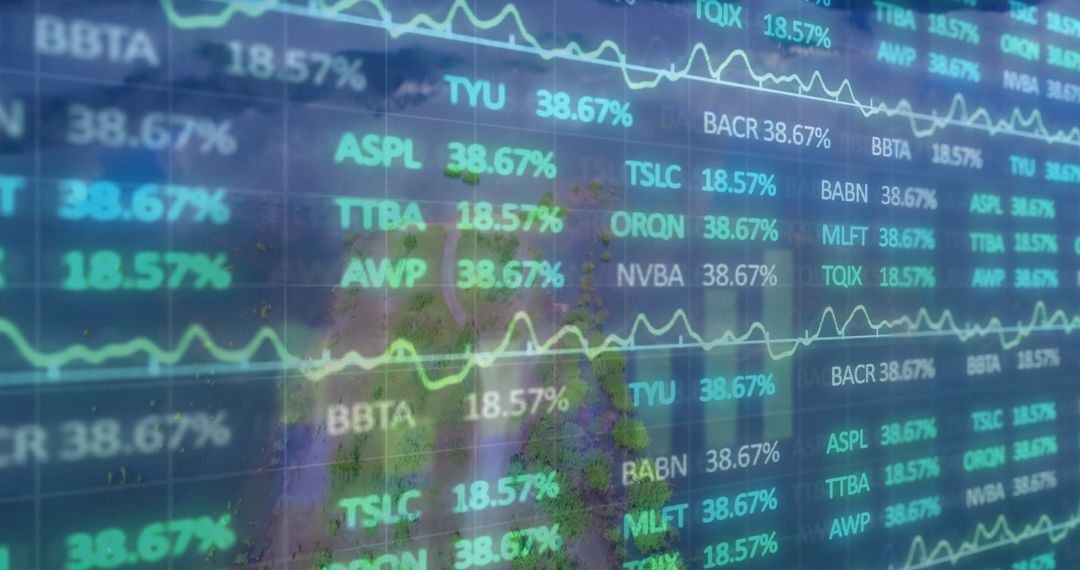
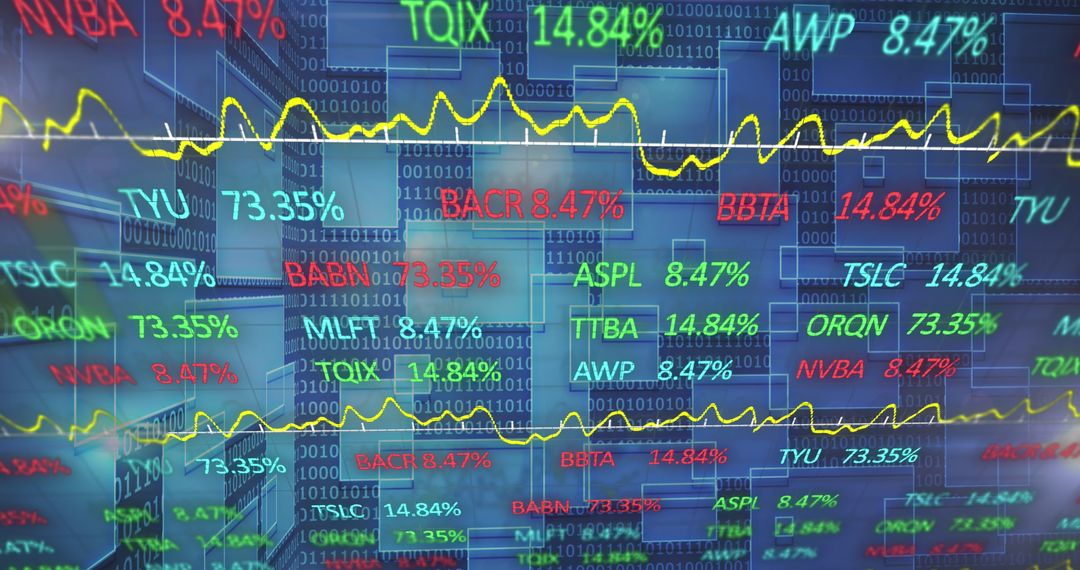
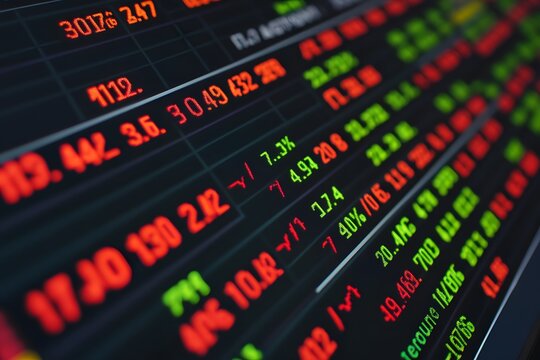
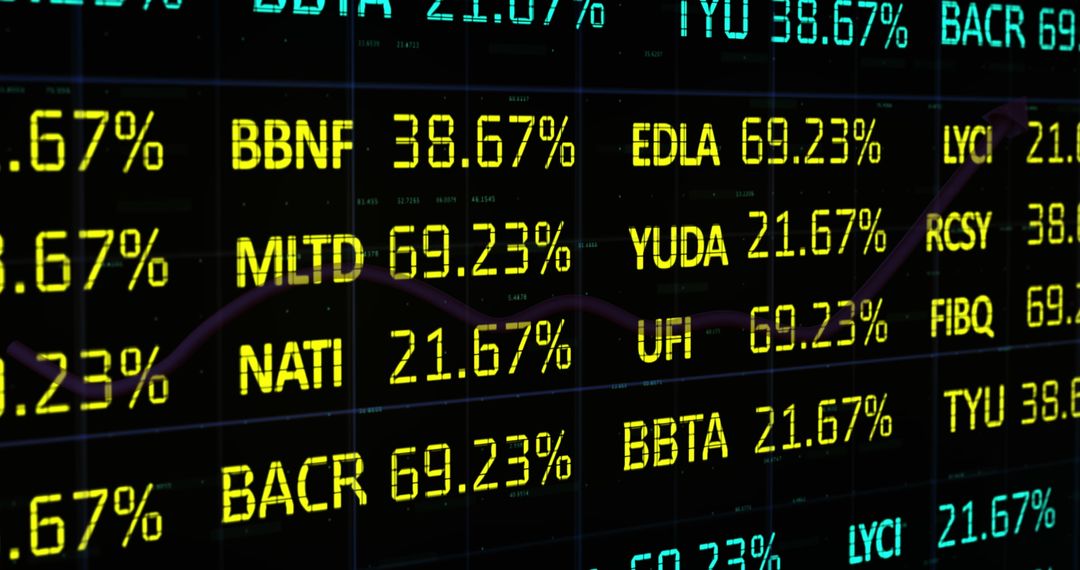
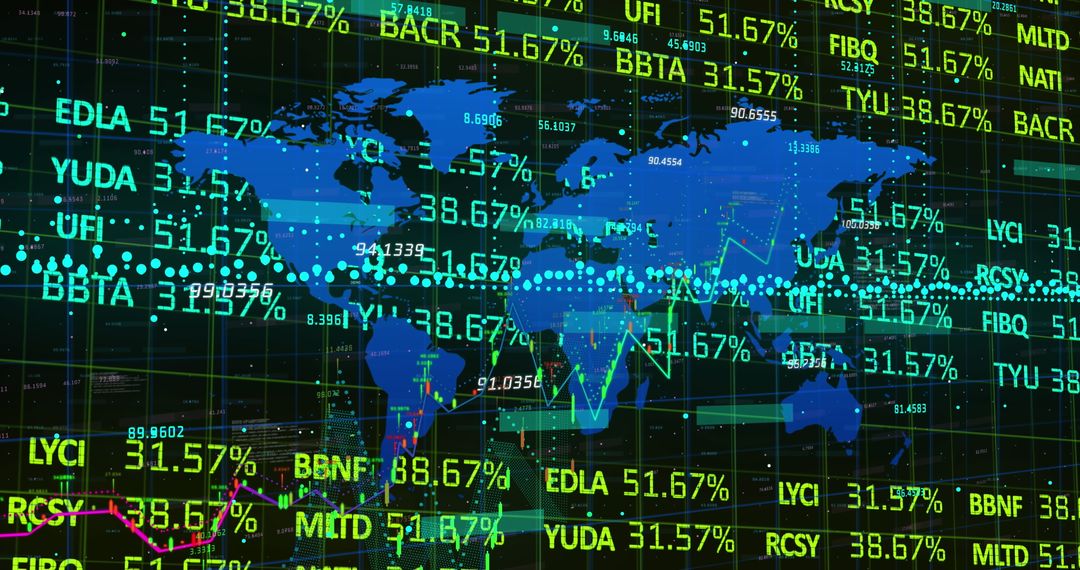
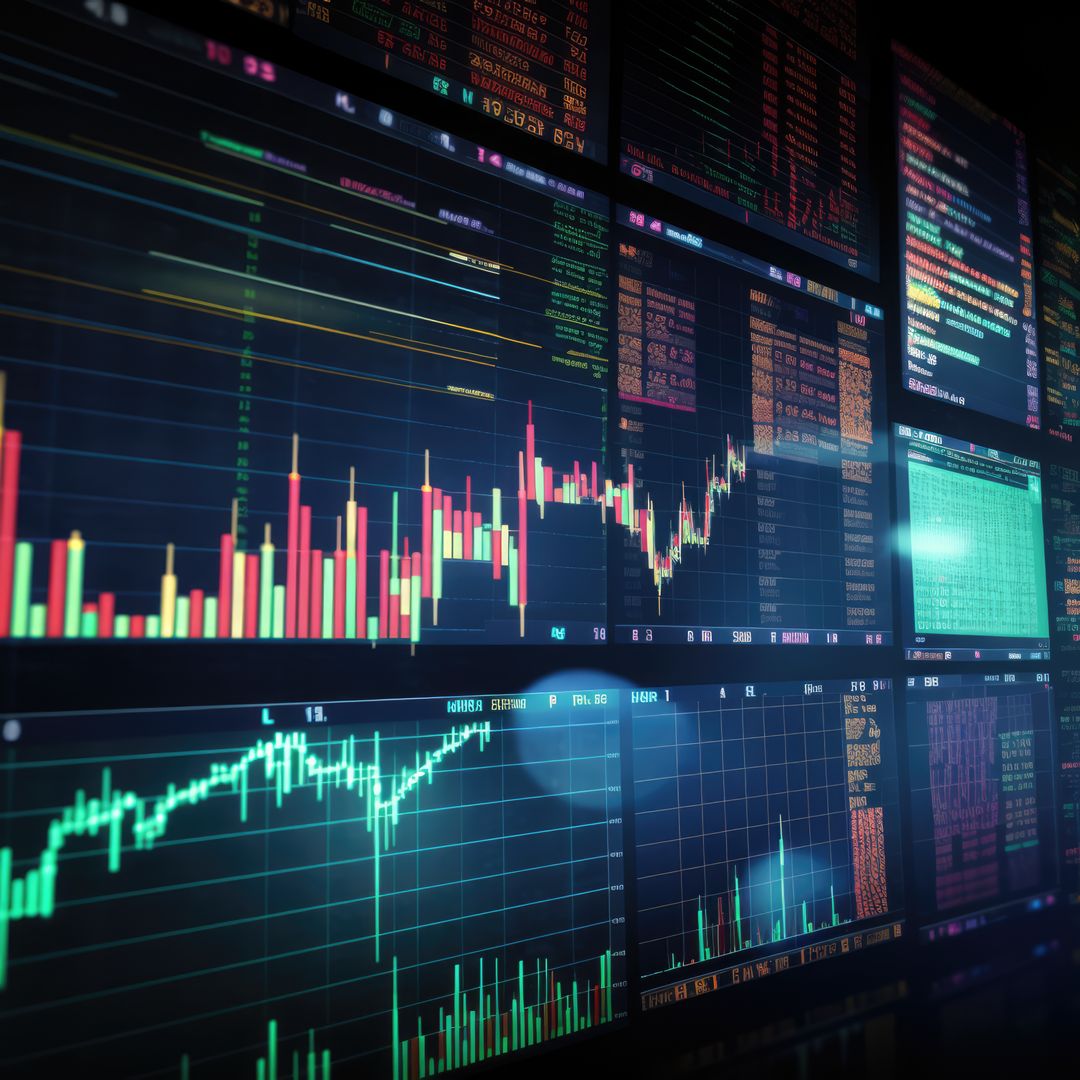
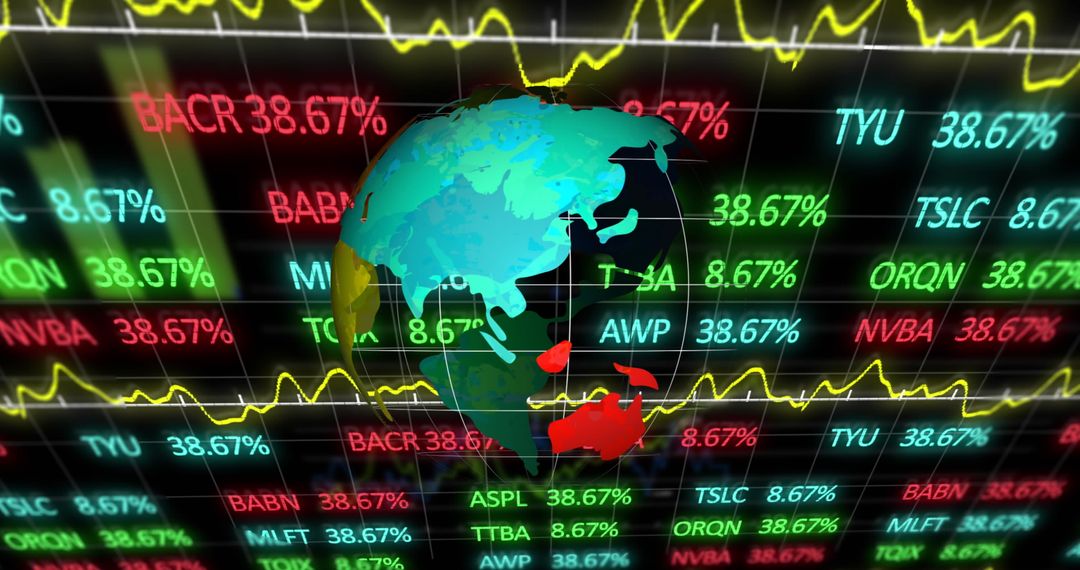
- Financial Data Screen with Stock Tickers and Line Graphs
Financial Data Screen with Stock Tickers and Line Graphs Image
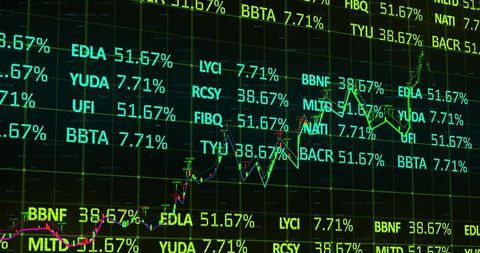
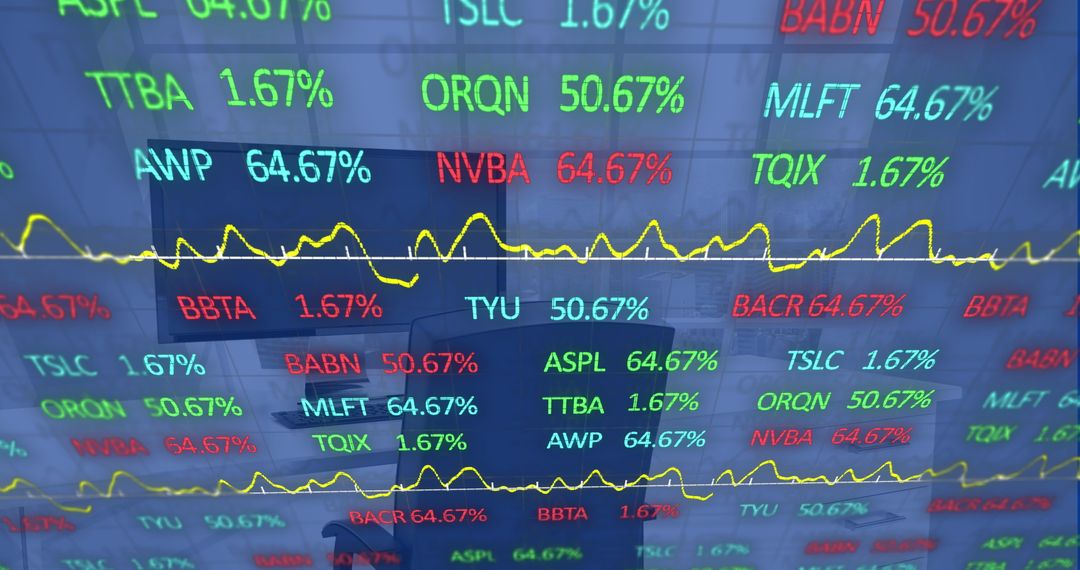
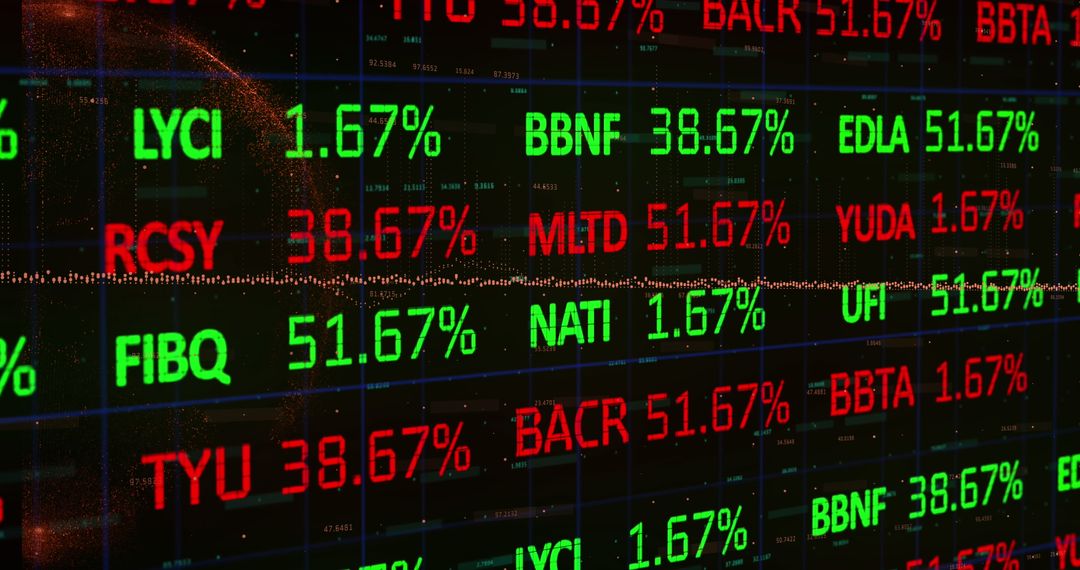
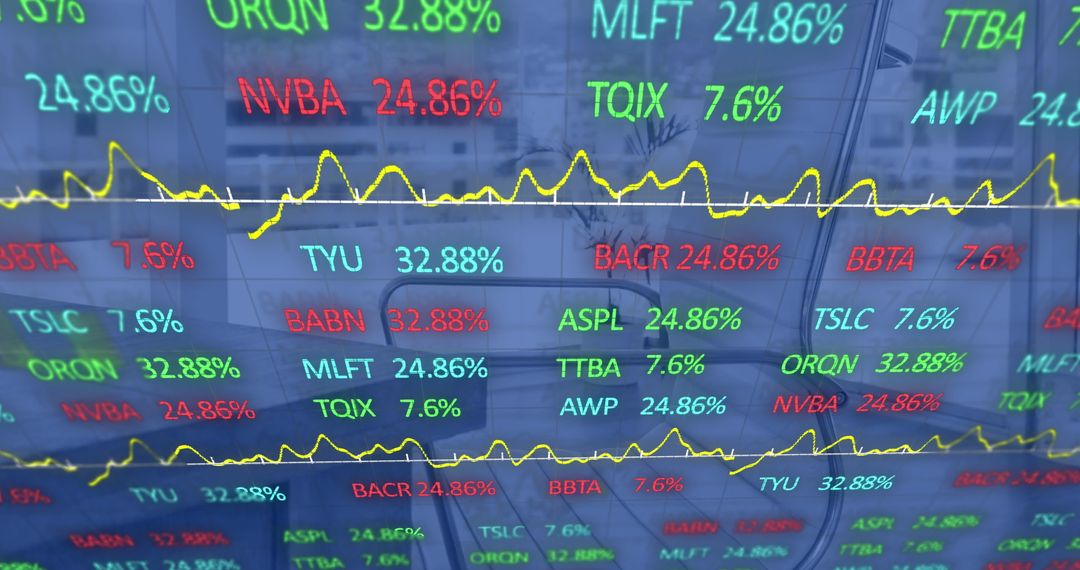
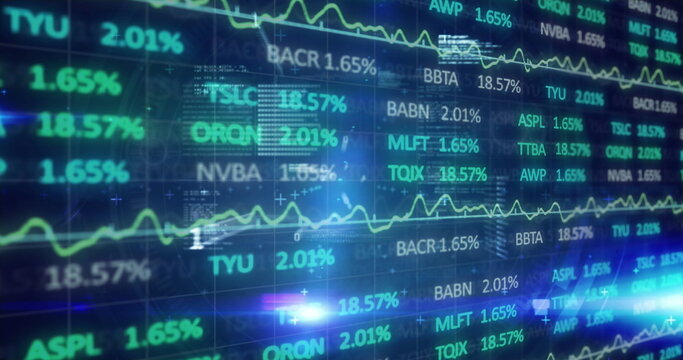
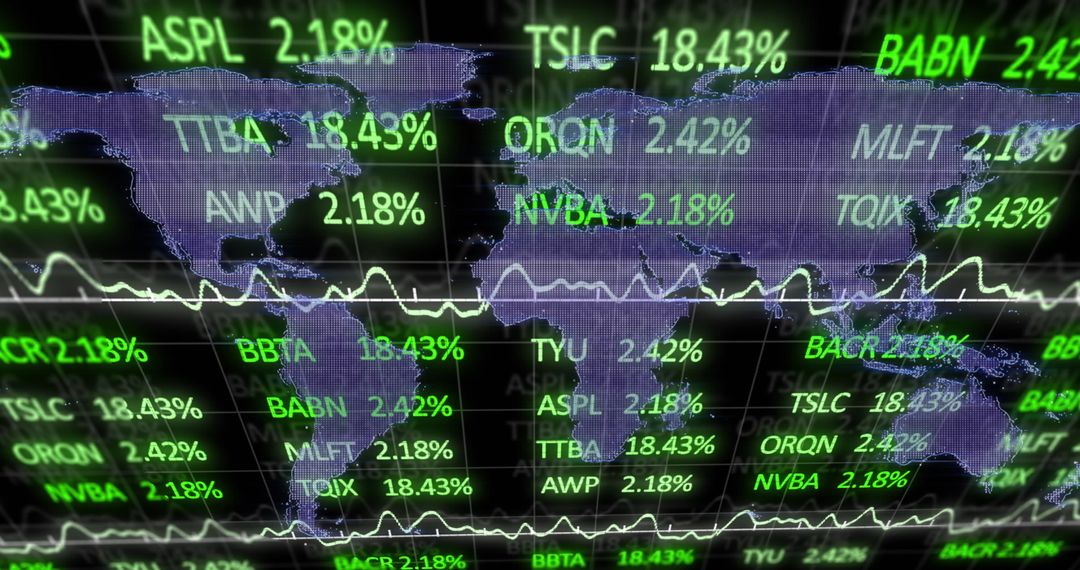
Displays a high-tech financial trading screen with vivid stock tickers and line graphs showing various data points. Useful for financial presentations, articles on stock market analysis, educational content on investments, and showcasing advanced data visualization techniques in business and finance. This can tell a powerful story about economic trends, market fluctuations, and investment strategies.
Powered by 

0
downloads
downloads
Tags:
More
Credit Photo
If you would like to credit the Photo, here are some ways you can do so
Text Link
photo Link
<span class="text-link">
<span>
<a target="_blank" href=https://pikwizard.com/photo/financial-data-screen-with-stock-tickers-and-line-graphs/bdd9c0c69d1d4f4d35c397eb932d4e3a/>PikWizard</a>
</span>
</span>
<span class="image-link">
<span
style="margin: 0 0 20px 0; display: inline-block; vertical-align: middle; width: 100%;"
>
<a
target="_blank"
href="https://pikwizard.com/photo/financial-data-screen-with-stock-tickers-and-line-graphs/bdd9c0c69d1d4f4d35c397eb932d4e3a/"
style="text-decoration: none; font-size: 10px; margin: 0;"
>
<img src="https://pikwizard.com/pw/medium/bdd9c0c69d1d4f4d35c397eb932d4e3a.jpg" style="margin: 0; width: 100%;" alt="" />
<p style="font-size: 12px; margin: 0;">PikWizard</p>
</a>
</span>
</span>
Free (free of charge)
Free for personal and commercial use.
Author: Authentic Images
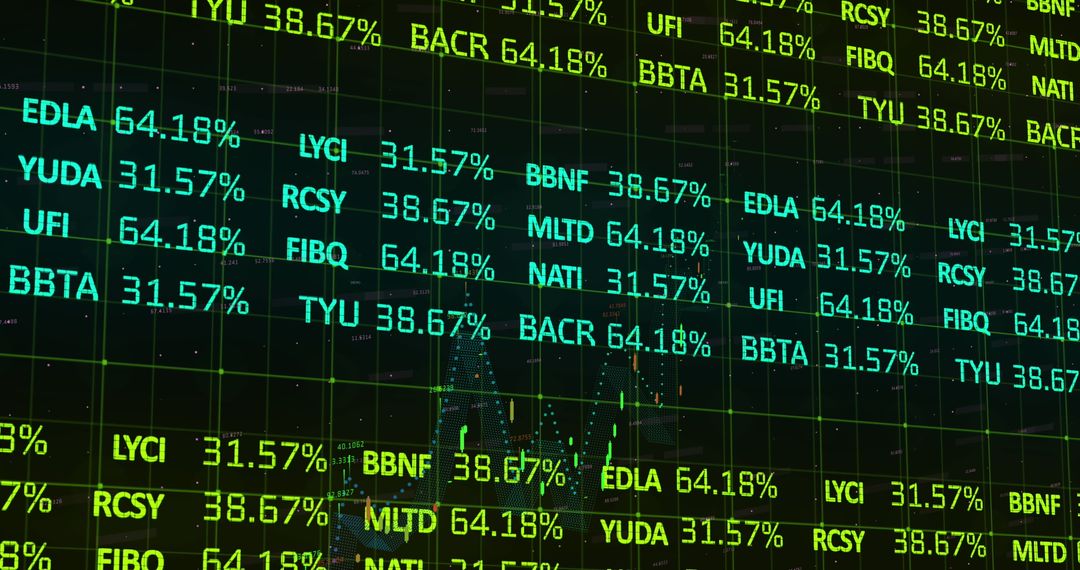
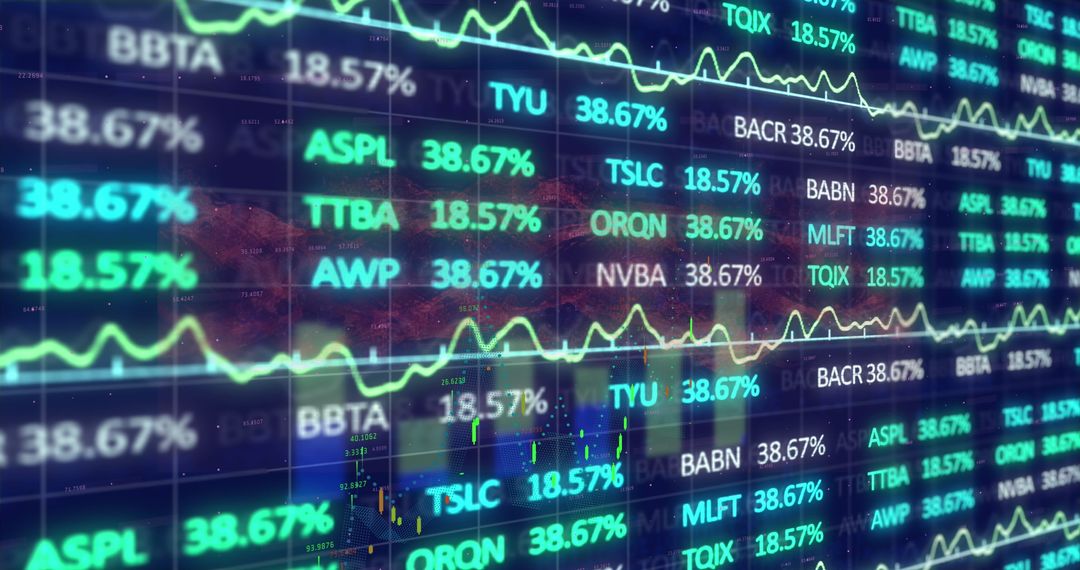
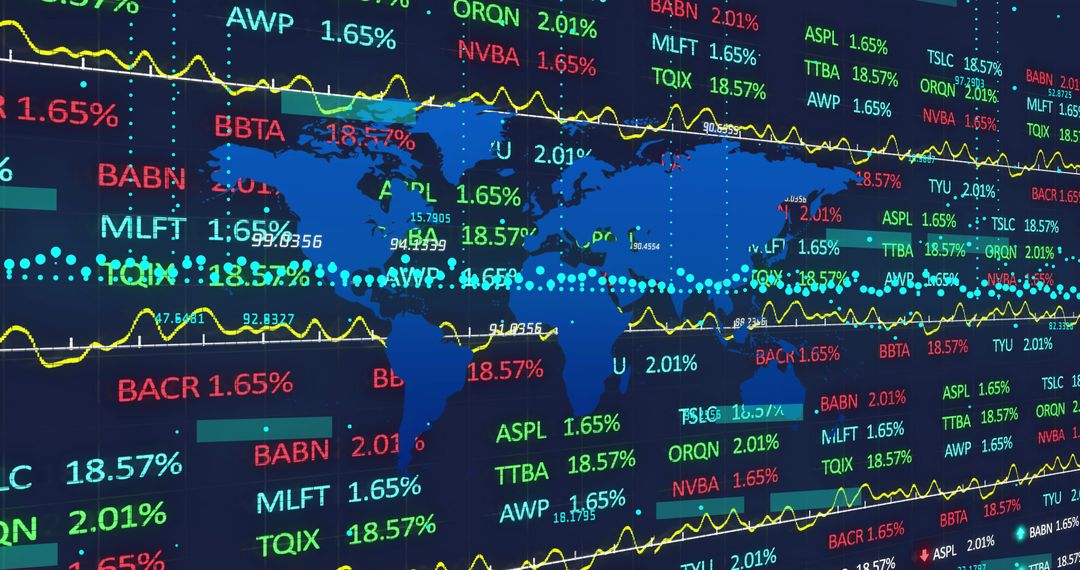
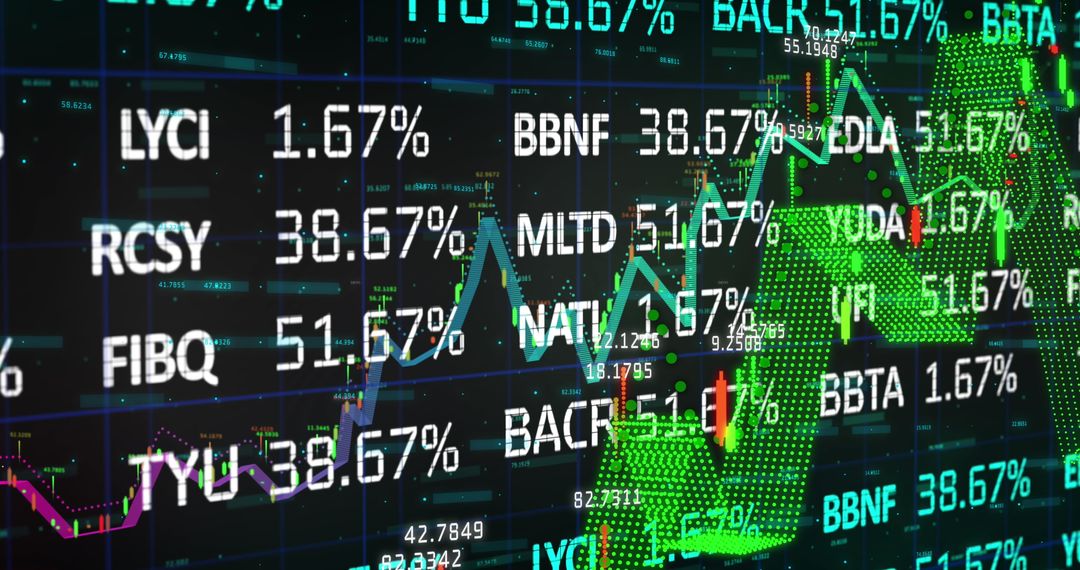
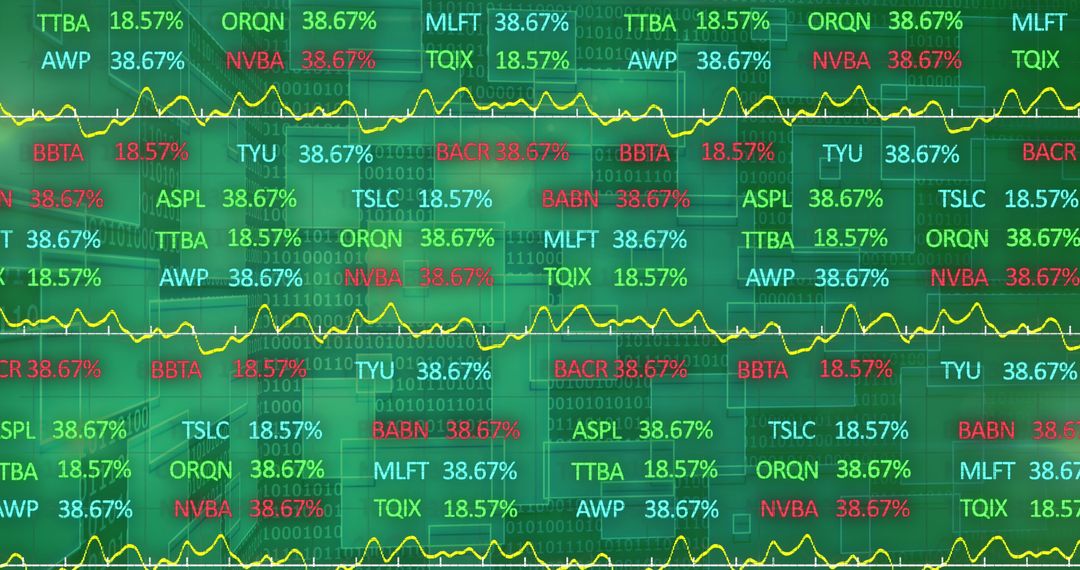
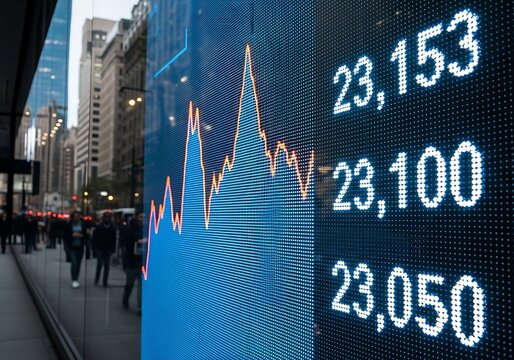
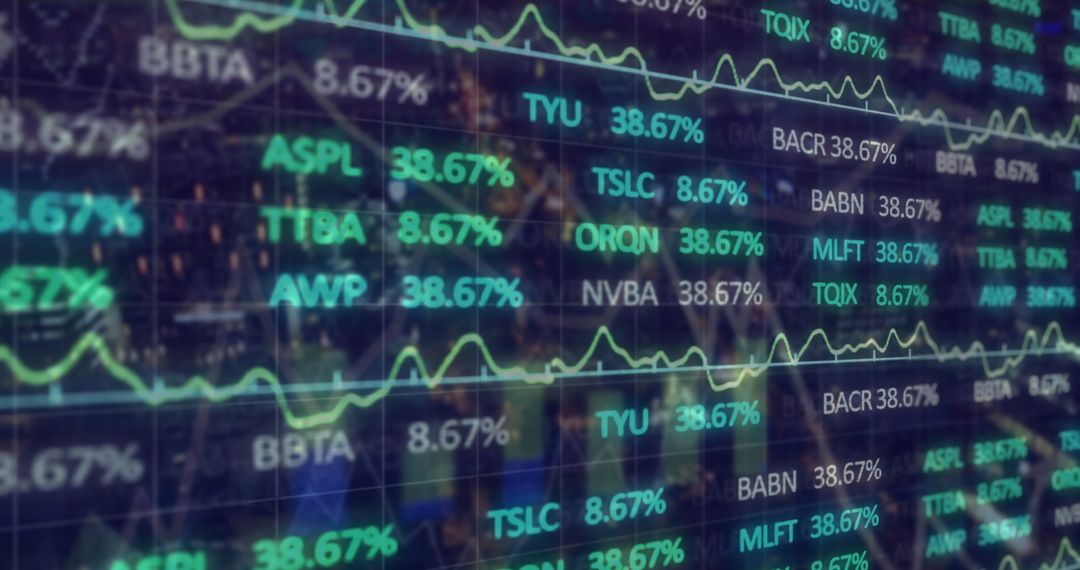
Similar Free Stock Images

Premium


Premium


Premium


Premium


Premium


Premium


Premium


Premium


Premium


Premium


Premium


Premium


Premium


Premium


Premium


Premium


Premium


Premium


Premium

Premium


Premium


Premium


Premium

Premium