1. Home > 
  2. Stock Photos > 
  3. Financial Data Visualization in Modern Office Atmosphere

Financial Data Visualization in Modern Office Atmosphere Image

Financial Data Visualization in Modern Office Atmosphere

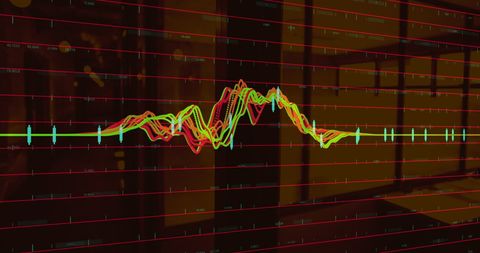
Digital lines in office backdrop portray complex financial data analytics. Ideal for business, finance, economics themes. Useful for illustrating global economic and stock market concepts.

Powered by Shutterstock logo - Get 15% off with code: PIKWIZARD15
Man Typing Keyboard Laptop Hand.Project Manager Researching Process.Business Team Working Startup modern Office.Global Strategy Virtual Icon.Innovation Graphs Interfaces.Analyze market stock.Blurred - Powered by Shutterstock - Get 15% off with code: PIKWIZARD15Businessman analyze and visualize complex information on a virtual screen using AI to process data. Big data technology and data science.Data flow.Digital neural network.artificial intelligence - Powered by Shutterstock - Get 15% off with code: PIKWIZARD15Data scientists. Business plan and strategy analysis. Businessman working on virtual screen with financial graph, big data. Algorithm. marketing and deep learning of artificial intelligence - Powered by Shutterstock - Get 15% off with code: PIKWIZARD15Scientist working with business data, finance, marketing report, Big Data Analytics technology, Processing Complexity information flow on virtual screen, machine learning, artificial intelligence, ML - Powered by Shutterstock - Get 15% off with code: PIKWIZARD15Business hierarchy structure. 
Relations of order or subordination between members. Business process and workflow automation with flowchart. Virtual screen Mindmap or Organigram. - Powered by Shutterstock - Get 15% off with code: PIKWIZARD15

Credit Photo

If you would like to credit the Photo, here are some ways you can do so

Free (free of charge)

Free for personal and commercial use.

Author: Authentic Images

Similar Free Stock Images

Digital Data Wave with Floating Numeric Values on Black Background
Premium
Man look at the dashboard with graphs and charts. Concept of data management system, business intelligence, data statistics, marketing analysis, key performance indicators (KPI) and analytics.
Dynamic Stock Market Graph with Global Economy Theme
Glowing Data Lines on Financial Graph Grid Background
Dynamic Financial Data Graph on Blue Digital Background
Colorful Digital Waveform Represents Global Connections
Premium
Online invoice processing, financial calculation, budgeting, payment management, and business expense tracking with digital forms, accounting software, and financial planning tools.
Stagflation Concept with Financial Data Coding Overlay
Red Financial Graph Depicting Economic Slumpflation Concept
Abstract Financial Data Visualization in Server Room
Digital Data Overlay on Urban Skyline Examining Global Business Trends
Premium
Wooden gears with financial data chart background, representing business process automation, technology, engineering, system integration, and digital transformation.
Digital Forex Data Over City Skyline Visualizing Market Trends
Digital Data Flow Over 3D Grid with Blue Graph Representation
European Market Data Overlay with EU Flag and Financial Graphs
Analyzing Stock Market Trends with Dynamic Graphs and Data
Premium
Financial data on a monitor as Finance data concept. Analytics Report Status Information Analysis Chart Graph in digital screen. Business analyzing financial statistics displayed on the tablet screen.
Digital Financial Data Processing with Glowing Indicators
Cybernetic Data Flow with Digital Network Connections
Dynamic Line Graph Transmits Data in Modern Office Environment
Digital Graph with Rising and Falling Lines on Grid Background
Premium
Big data and AI technology, Business intelligence and AI data science, Automating data processing, Machine learning and business intelligence, AI driven data processing, KPI performance monitoring.
Dynamic Financial Chart with Upward Growth Arrow
Dynamic Financial Graphs Overlaying Urban Skyline
Dynamic Stock Market Graph with ECO Icons
Abstract Digital Interface Showing Data Analysis Concept
Premium
Cost reduction concept. Businesswoman pointing down arrow of the graph with cost reduction business finance on virtual screen. Business, technology, cost management, cut budget.
Financial Data with Molecular Background Concept
Dynamic Financial Data Displays Stock Market Trends
Financial Growth Stock Nikkei in Urban City Skyline
Binary Code with Neon Light Trails and Data Waves
Premium
Global Connections Virtual Icon Innovation Graph Interface.Young Business Team Brainstorming Meeting Room Process.Coworkers Startup Marketing Online Project.Creative People Making Great Work Decision
Dynamic Graph Showing Vibrant Stock Market Trends
Futuristic Stock Market Graph with Digital Data
Premium
DevOps software development and IT operations programer development concept with dev and ops icon computer screen project manager operation sysadmin.working in agile methodology environment
Line Graphs on Digital Background Show Financial Data Trends
Digital Financial Data Overlaying City Skyline at Dusk
Futuristic Circuit Board with Digital Data Flow Patterns
Futuristic Digital Data Analytics Interface Display
Premium
Data document content management system search and online file transfer download or doc sharing and database digital cloud drive storage service on computer network technology analytics concepts
Digital Visualization of Economic Slumpflation Concept
Digital Financial Data on Server with Stock Market Graph
Abstract Digital Blue Dot Graph with Floating Numbers
Analyzing Accelerating Data Trends on Grid with Tech Insights
Premium
business people analyze virtual graphic financial graph chart diagram on mobile laptop computer, digital technology, business strategy, stock market investment, business finance technology concept
Data Trends and Analysis on 3D Digital Grid
Digital Financial Data Graph Showcasing Market Trends
Dynamic Stock Market Graphs Over Digital Interface
Futuristic Digital Data Visualization on Blue Background
Premium
Data analysis science and big data with AI technology. An analyst or Scientist uses a computer and dashboard to analyze information on complex data sets on a computer. Insights development engineer.
Data Visualization with Rising Red Arrow and Floating Numbers
Dynamic Financial Data Charts in Modern Office Background
Digital Financial Analysis with Glowing Green Charts
Financial Data Analysis Vibrant Graphs on Blue Background
Premium
Automated data analytics with AI for business management and strategy. Insights dashboard created with artificial intelligence. KPI report with metrics . Finance, operations, marketing.
Dynamic Financial Data on Digital Screen
Global Stock Market Data Visualization on Digital Map Background
Futuristic Data Wave Over Server Room Technology Concept
Colorful Digital Waveforms Overlapping Server Racks in Modern Data Center
Premium
Data Management System (DMS) with Business Analytics concept. businessman working with provide information for Key Performance Indicators (KPI) and marketing analysis onn virtual computer
Dynamic Stock Market Chart with Fluctuating Trends and Data Points
Abstract Digital Data and Network Connections Background
Digital Security Concept with Green Shield and Lock on Data Grid
Colorful Lines Representing Stock Market Trends on Digital Screen
Dynamic Financial Market Chart on Digital Grid
Dynamic Stock Market Graph Display on Digital Grid
Premium
Man look at the dashboard with graphs and charts. Concept of data management system, business intelligence, data statistics, marketing analysis, key performance indicators (KPI) and analytics.
Business Growth Concept with Graphs Overlay in Warehouse
Vibrant Green ECG Display on Black Background Media
Dynamic Green Stock Chart on Digital Grid Background
Rising Graph with Digital Data Interface Analysis
Premium
3D blue bar graph rising, sotck market informations
Global Economy Displaying Growth Trends with Ukraine-NATO Financial Outlook
Abstract Technology Chart with Blue Dots on Black Background
Financial Graph Overlaying Retail Store Backdrop Visualizing Market Trends
Dynamic Stagflation Concept Displaying Economic Burdens
Premium
Businesswoman working with business data, finance, marketing report, Big Data Analytics technology, Processing Complexity information flow on virtual screen, machine learning, artificial intelligence.
Digital Data Over Empty Warehouse for Global Shipping Analysis
Financial Data Analysis with Declining Trends
Dynamic Financial Data Visualizations on Grid Interface
Digital Finance Chart Overlaying Globe Background
Premium
Financial data on a monitor as Finance data concept. Analytics Report Status Information Analysis Chart Graph in digital screen. Business analyzing financial statistics displayed on the tablet screen.
Dynamic Data Processing Concept in Digital Interface Design
Data Trends Overlayed on Cityscape Skyscrapers
Abstract Graphs Over Modern Building at Night
Financial Data Processing with Green Digital Graph in Action
Premium
Businessman Analyzing Futuristic Data Dashboard Displaying Graphs And Insights In Office
Global Data Analytics Over World Map with Numeric Statistics
Abstract Data Network with Financial Analytics Overlay
Global Finance and Data Analytics in Server Environment
Dynamic Financial Data Chart Showing Trend Analysis
Premium
Data analysis science and big data with AI technology. Analyst or Scientist uses a computer and dashboard for analysis of information on complex data sets on computer. Insights development engineer
Binary Data Flow with Abstract Neon Light Trails
Futuristic Digital Waveform with White and Green Design
Colorful Stock Market Graph Displaying Economic Trends
Dynamic Financial Graph on Digital Grid in Stock Market Analysis
Abstract Digital Graphs Showing Financial Data Analysis
Graph Lines Portraying Financial Data Trends
Premium
Analytical data and development statistics. Web analytics and product testing techniques are being measured. A guy studies an SEO dashboard and a digital report.
Dynamic Data Waves on Digital Grid
Stagflation Concept with Financial Market Downturn
Digital Red Wave Graph with Inflation Text and Data
Digital Stock Data Overlay in Modern Server Room
Premium
Data analysis science and big data with AI technology. Analyst or Scientist uses a computer and dashboard for analysis of information on complex data sets on computer. Insights development engineer
Dynamic Flow of Stock Market Data with Floating Numbers
Data Analytics Overlay on Night City Road with Digital Interface
Inflation Impact with Graphs and Data Overlays in Green
Digital Line Graph Overlay on Modern Office Space
Premium
Woman Touching Screen Electronic Tablet Hand.Project Managers Researching Process.Business Team Working New Startup modern Office.International Digital Diagrams Interfaces.Analyze market stock.Blurred
Data Analytics Graphs on Digital Interface Background
Digital Graph Representing Data Analysis and Technology
Dynamic Data Analysis over Virtual Grid with Neural Patterns
Abstract Network Connections with Financial Data Overlay
Premium
Digital business marketing data management on virtual screen, Businessman use laptop work marketing analysis chart strategic planning analytics dashboard with management data work in modern office
Financial Growth Curve Over City Skyline Displaying Business Trends
NFT Financial Data Visualization with Digital Graph Overlay
Digital Stock Market Display with Data Analysis Graphics
Real-Time Financial Data Analysis with Graphs and Charts
Premium
business analytics intelligence BI concept, KPI, financial charts to analyze profit and finance performance of company
Businessman Using VR in Data Center with Virtual Graph Overlay
Abstract Representation of Financial Data Processing
Financial Stock Market Data Visualization with Declining Trends
Abstract Digital Data Visualization on Black Background
Premium
Businessman using smartphone with digital risk management dashboard, financial data, charts, and icons on dark background, fintech concept
Futuristic Neon Data Dashboard with Vibrant Analytics Tooltip